
Page 53 - Fort Worth City Budget 2019
P. 53
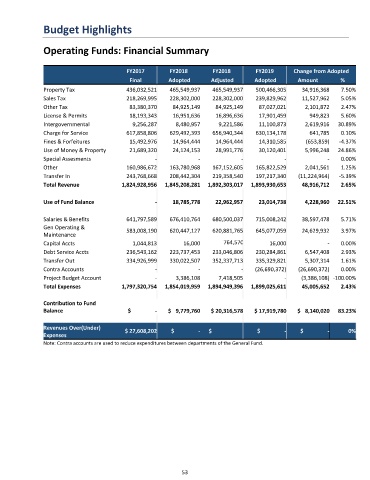
Budget Highlights


               Operating Funds: Financial Summary


                                           FY2017        FY2018        FY2018         FY2019      Change from Adopted
                                            Final        Adopted       Adjusted       Adopted       Amount        %
               Property Tax                436,032,521   465,549,937   465,549,937    500,466,305    34,916,368   7.50%
               Sales Tax                   218,269,995   228,302,000   228,302,000    239,829,962    11,527,962   5.05%
               Other Tax                    83,380,370    84,925,149    84,925,149     87,027,021     2,101,872   2.47%
               License & Permits            18,193,343    16,951,636    16,896,636     17,901,459      949,823    5.60%
               Intergovernmental             9,256,287     8,480,957     9,221,586     11,100,873     2,619,916  30.89%
               Charge for Service          617,858,806   629,492,393   656,940,344    630,134,178      641,785    0.10%
               Fines & Forfeitures          15,492,976    14,964,444    14,964,444     14,310,585     (653,859)  -4.37%
               Use of Money & Property      21,689,320    24,124,153    28,991,776     30,120,401     5,996,248  24.86%
               Special Assesments                   -              -             -             -             -    0.00%
               Other                       160,986,672   163,780,968   167,152,605    165,822,529     2,041,561   1.25%
               Transfer In                 243,768,668   208,442,304   219,358,540    197,217,340   (11,224,964)  -5.39%
               Total Revenue             1,824,928,956  1,845,208,281  1,892,303,017  1,893,930,653  48,916,712   2.65%


               Use of Fund Balance                  -     18,785,778    22,962,957     23,014,738     4,228,960  22.51%

               Salaries & Benefits         641,797,589   676,410,764   680,500,037    715,008,242    38,597,478   5.71%
               Gen Operating &             583,008,190   620,447,127   620,881,765    645,077,059    24,629,932   3.97%
               Maintenance
               Capital Accts                 1,044,813        16,000       764,570        16,000             -    0.00%
               Debt Service Accts          236,543,162   223,737,453   233,046,806    230,284,861     6,547,408   2.93%
               Transfer Out                334,926,999   330,022,507   352,337,713    335,329,821     5,307,314   1.61%
               Contra Accounts                      -              -             -   (26,690,372)   (26,690,372)  0.00%
               Project Budget Account               -      3,386,108     7,418,505             -     (3,386,108) -100.00%
               Total Expenses            1,797,320,754  1,854,019,959  1,894,949,396  1,899,025,611  45,005,652   2.43%


               Contribution to Fund
               Balance                     $        -    $   9,779,760   $           $ 17,919,780   $   8,140,020   83.23%


               Revenues Over(Under)       $ 27,608,202    $        -    $             $                -  $  -      0%
               Expenses
               Note: Contra accounts are used to reduce expenditures between departments of the General Fund.


                                                             53