Page 82 - CityofArlingtonFY26AdoptedBudget
P. 82

Business Plan


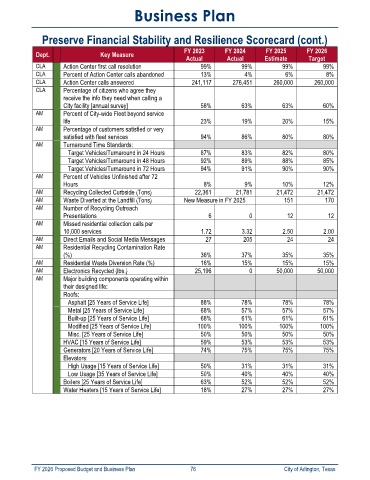
               Preserve Financial Stability and Resilience Scorecard (cont.)
                                                              FY 2023      FY 2024       FY 2025      FY 2026
             Dept.                Key Measure
                                                               Actual       Actual       Estimate      Target
             CLA      Action Center first call resolution          99%           99%          99%           99%
             CLA      Percent of Action Center calls abandoned     13%            4%           6%            8%
             CLA      Action Center calls answered               241,117      276,451       260,000      260,000
             CLA      Percentage of citizens who agree they
                      receive the info they need when calling a
                      City facility [annual survey]                58%           63%          63%           60%
             AM       Percent of City-wide Fleet beyond service
                      life                                         23%           19%          20%           15%
             AM       Percentage of customers satisfied or very
                      satisfied with fleet services                94%           86%          80%           80%
             AM       Turnaround Time Standards:
                        Target Vehicles/Turnaround in 24 Hours     87%           83%          82%           80%
                        Target Vehicles/Turnaround in 48 Hours     92%           89%          88%           85%
                        Target Vehicles/Turnaround in 72 Hours     94%           91%          90%           90%
             AM       Percent of Vehicles Unfinished after 72
                      Hours                                         8%            9%          10%           12%
             AM       Recycling Collected Curbside (Tons)         22,361       21,781        21,472       21,472
             AM       Waste Diverted at the Landfill (Tons)   New Measure in FY 2025           151           170
             AM       Number of Recycling Outreach
                      Presentations                                   6             0           12            12
             AM       Missed residential collection calls per
                      10,000 services                               1.72         3.32          2.50         2.00
             AM       Direct Emails and Social Media Messages        27           205           24            24
             AM       Residential Recycling Contamination Rate
                      (%)                                          36%           37%          35%           35%
             AM       Residential Waste Diversion Rate (%)         16%           15%          15%           15%
             AM       Electronics Recycled (lbs.)                 25,196            0        50,000       50,000
             AM       Major building components operating within
                      their designed life:
                      Roofs:
                        Asphalt [25 Years of Service Life]         88%           78%          78%           78%
                        Metal [25 Years of Service Life]           68%           57%          57%           57%
                        Built-up [25 Years of Service Life]        68%           61%          61%           61%
                        Modified [25 Years of Service Life]       100%          100%         100%          100%
                        Misc. [25 Years of Service Life]           50%           50%          50%           50%
                      HVAC [15 Years of Service Life]              59%           53%          53%           53%
                      Generators [20 Years of Service Life]        74%           75%          75%           75%
                      Elevators:
                        High Usage [15 Years of Service Life]      50%           31%          31%           31%
                        Low Usage [35 Years of Service Life]       50%           40%          40%           40%
                      Boilers [25 Years of Service Life]           63%           52%          52%           52%
                      Water Heaters [15 Years of Service Life]     18%           27%          27%           27%


            FY 2026 Proposed Budget and Business Plan                                        76                                                                City of Arlington, Texas
   77   78   79   80   81   82   83   84   85   86   87