
Page 492 - FY 2025 Adopted Operating Budget and Business Plan
P. 492
Return to Table of Contents
100% 94% 100% 8.73% 95% 99% 5% 24,458 24% 100% 81% 87% 89% 11% 1,726 12.89 0 0 3% 0 0 38% 17%
Sept.
100% 94% 100% 9.08% 99% 4% 16,432 100% 80% 89% 91% 9% 1,776 12.24 0 0 3.40% 2 18,011 38% 17%
Aug.
100% 94% 100% 5.96% 99% 4% 26,164 100% 80% 88% 91% 9% 1,907 11.71 0 0 3.20% 1 5,202 38% 16%
July
100% 92% 100% 10.71% 98% 99% 4% 21,671 20% 77% 84% 90% 92% 8% 1,791 13.4 0 5.3% 3 34,044 36% 16%
June
100% 92% 100% 8.19% 99% 4% 22,706 77% 84% 90% 91% 9% 2,043 16.41 0 4.4% 3 37,154 36% 16%
May
100% 92% 100% 9.86% 99% 3% 23,664 77% 88% 93% 94% 6% 1,913 15.15 0 4.6% 0 0 36% 16%
April
80% 79% 86% 93% 78% 10% 93% 99% 4% 21,671 63% 21% 100% 85% 91% 93% 7% 1,749 14.2 0 5.95% 16 474,861 36% 13%
Mar.
86% 93% 78% 10% 99% 5% 22,706 100% 83% 88% 90% 10% 1,712 13.44 0 3.56% 24 330,733 36% 13%
Feb.
86% 93% 78% 12% 99% 5% 23,664 100% 81% 88% 91% 9% 1,796 12.46 0 1.14% 34 536,902 36% 13%
Jan.
100% 94% 76% 8.6% 89% 99% 4% 19,115 100% 82% 88% 90% 10% 1,732 12.38 0 0 1.5% 29 173,398 36% 13%
Dec. 22%
100% 94% 76% 8% 99% 4% 20,249 100% 81% 88% 90% 10% 1,840 11.86 0 0 1.9% 18 144,532 36% 16%
Nov.
100% 94% 76% 9.1% 99% 6% 22,672 100% 83% 91% 93% 7% 1,796 13.57 0 1.86% 10 114,583 36% 13% 24,925
Oct.
80% 79% 93.33% 91.30% 87.23% 9% 94% 99% 4% 276,451 63% 19% 86.49% 83% 89% 91% 9% 21,781 160 0 3.32% 205 37% 15%
FY 2024 Actual 2,013,952
100% 94% 100% 8% 95% 99% 5% 77,054 24% 100% 80% 88% 91% 9% 5,409 36.84 0 3% 3 23,213 38% 17%
FY 2024 4th Qtr. Actual
FY 2024 3rd Qtr. Actual 100% 92% 100% 9.6% 98% 99% 4% 69,320 20% 77% 86% 91% 93% 7% 5,747 31.56 0 4.80% 6 71,198 36% 16%
80% 79% 86% 93% 78% 10.66% 93% 99% 5% 71,880 63% 21% 100% 83% 89% 91% 9% 5,257 40.1 0 2.35% 139 1,342,496 36% 14%
FY 2024 2nd Qtr. Actual
100% 94% 76% 9% 89% 99% 5% 62,036 22% 100% 82% 89% 91% 9% 5,368 37.81 0 0 1.88% 57 577,045 36% 14% 24,925
FY 2024 1st Qtr. Actual
80% 80% 90% 95% 90% 8% 80% 99% 6% 245,000 60% 20% 80% 80% 85% 90% 8% 23,500 200 600 3 < 2.5 100 200,000 < 45% > 9.7 50,000
FY 2024 Annual Target
80% 80% 95% 94% 73.53% 9% 89% 99% 13% 241,117 58% 23% 94% 87% 92% 94% 8% 22,361 174.59 674 6 1.72 27 246,369 36% 16% 25,196
FY 2023 Actual
81% 83% 90% 96% 78% 9.18% 99% 9% 245,512 61% 28% 91% 83% 68% 66% 21,094 143.68 265.3 3 1.49
FY 2022 Actual
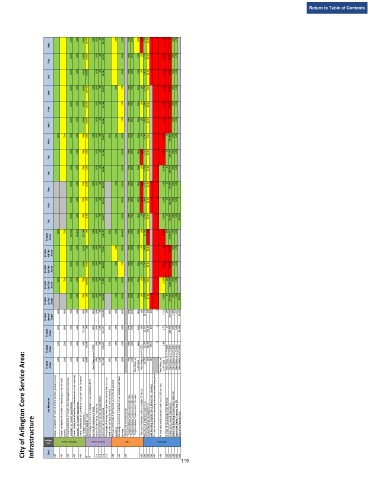
City of Arlington Core Service Area:
84% 81% 81% 96% 96% 6.9% New Measure in FY 2023 99% 12% 251,436 64% 25% 83% 71% 21% New Measure in FY 2023 23,799 159 252 New Measure in FY 2023 New Measure in FY 2023 New Measure in FY 2023 New Measure in FY 2023 New Measure in FY 2023
FY 2021 Actual New Measure in FY 2022 New Measure in FY 2022
Key Measures Citizen perception of trash collection services [annual survey] Citizen perception of residential recycling services [annual Overall satisfaction of Construction Management’s services “exceeds” or “meets” expectations Overall satisfaction of facility maintenance and repair services “exceeds” or “meets” expectations Overall satisfaction of custodial services contractor “exceeds” Percentage of customers satisfied or very satisfied with IT Action Cen
Infrastructure Goal Category survey] Satisfaction Ratings or “meets” expectations Helpdesk abandon rate Services [measured quarterly] Action Center calls answered Customer Service quarterly] services Turnaround Time Standards: Fleet Solid Waste Electronics Recycled (lbs)
Dept.
AM
AM
AM
AM
AM
AM
AM
AM
AM
AM
AM
AM
AM
AM
AM
AM
AM
CLA
AM
AM
CLA
CLA
CLA
IT
IT
119