
Page 494 - FY 2025 Adopted Operating Budget and Business Plan
P. 494
Return to Table of Contents
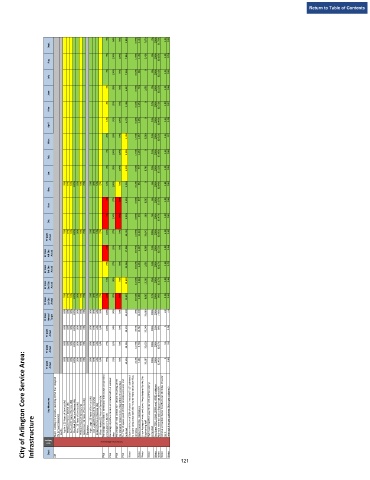
9% 84% 98% 2,630 3.09% 1,140 7,070 2% 100% 91.70% 0.32 0.29
Sept.
9% 100% 100% 7,644 4.08% 1,166 2,438 6% 100% 89.16% 0.24 0.74
Aug.
7% 100% 99% 7,594 3.62% 941 0 6% 100% 88.31% 0.32 0.61
July
6% 98% 98% 4,337 3.78% 729 1,651 8% 100% 88.32% 0.24 0.46
June
4% 95% 99% 2,168 3.41% 1,254 0 12% 100% 89.71% 0.80 0.27
May
12% 96% 100% 4,178 3.43% 1,051 0 14% 100% 89.48% 0.32 1.00
April
20% 93% 97% 1,129 4.01% 1,037 3,500 13% 100% 89.52% 0.32 0.7
Mar.
5% 100% 100% 3,326 4.01% 1,030 0 12% 100% 90.66% 0.32 0.43
Feb.
8% 98% 100% 4,205 3.53% 577 6,781 10% 100% 90.32% 0.24 0.33
Jan.
78% 57% 61% 100% 50% 53% 75% 31% 40% 52% 27% 10% 100% 93% 2,210 3.15% 832 0 6% 100% 89.64% 0.64 0.52
Dec.
3% 97% 86% 3,920 3.58% 877 8,502 6% 100% 90.87% 1.04 0.49
Nov.
5% 100% 90% 4,819 3.80% 979 100 5% 100% 90.47% 0.48 0.51
Oct.
78% 57% 61% 100% 50% 53% 75% 31% 40% 52% 27% 100% 97% 97% 48,162 43.50% 11,613 30,042 100% 100% 89.85% 5.28 1.59
FY 2024 Actual
26% 95% 99% 17,868 10.79% 3,247 9,508 14% 100% 89.72% 0.88 1.64
FY 2024 4th Qtr. Actual
73% 97% 96% 30,294 10.62% 3,034 1,651 34% 100% 89.17% 1.36 1.73
FY 2024 3rd Qtr. Actual
51% 98% 94% 19,610 11.55% 2,644 10,281 35% 100% 90.17% 0.88 1.46
FY 2024 2nd Qtr. Actual
78% 57% 61% 100% 50% 53% 75% 31% 40% 52% 27% 18% 99% 90% 10,950 10.54% 2,688 8,602 17% 100% 90% 2.16 1.53
FY 2024 1st Qtr. Actual
88% 68% 68% 100% 50% 59% 74% 30% 30% 63% 20% 100% 90% 95% 40,000 20% 10,000 30,000 100% 100% > 88% ≤ 8 < 4
FY 2024 Annual Target
88% 68% 68% 100% 50% 59% 74% 50% 50% 63% 18% 100% 94% 95% 39,178 33.9% 10,732 30,249 100% 10% 89% 5 1.06
FY 2023 Actual
88% 68% 68% 100% 50% 60% 74% 56% 80% 63% 18% 77% 85% 93% 39,236 41.75% 8,704 32,020 100% 100% 89.57% 4.3 2.8
FY 2022 Actual
City of Arlington Core Service Area:
88% 68% 68% 100% 50% 59% 74% 56% 80% 63% 18% 99% 91% 98% 53,495 22.5% 7,481 30,187 100% 100% 92.45% 4 3.40
FY 2021 Actual
Key Measures Major building components operating within their designed Asphalt [25 Years of Service Life] Metal [25 Years of Service Life] Built‐up [25 Years of Service Life] Modified [25 Years of Service Life] Misc. [25 Years of Service Life] HVAC [15 Years of Service Life] Generators [20 Years of Service Life] High Usage [15 Years of Service Life] Low Usage [35 Years of Service Life] Boilers [25 Years of Service Life] Water Heaters [15 Years of Service Life] Per
Infrastructure Goal Category life [annual measures]: Roofs: Elevators: annual goal of 1,642.25 days Infrastructure Maintenance replaced Initiative Radio Transmitter installations Engineering staff completed main
Dept.
Water
Water
Water
Water
Water
Water
Water
Water
PWK
PWK
PWK
PWK
AM
121