
Page 122 - CityofWataugaAdoptedBudgetFY24
P. 122
BUDGET SUMMARY
10 YEAR HISTORY OF PROPERTY TAX RATES
Property Tax Rate History
M&O I&S TOTAL
FY15 $0.412887 $0.178329 $0.591216
FY16 $0.440171 $0.178547 $0.618718
FY17 $0.423017 $0.195394 $0.618411
FY18 $0.419650 $0.182138 $0.601788
FY19 $0.420620 $0.181168 $0.601788
FY20 $0.405884 $0.174616 $0.580500
FY21 $0.400696 $0.179708 $0.580404
FY22 $0.395445 $0.184955 $0.580400
FY23 $0.375187 $0.195013 $0.570200
FY24 proposed $0.359710 $0.210490 $0.570200
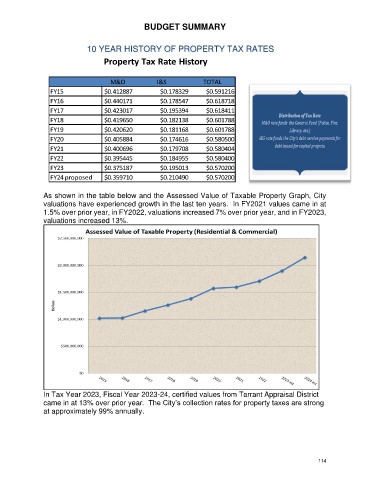
As shown in the table below and the Assessed Value of Taxable Property Graph, City
valuations have experienced growth in the last ten years. In FY2021 values came in at
1.5% over prior year, in FY2022, valuations increased 7% over prior year, and in FY2023,
valuations increased 13%.
In Tax Year 2023, Fiscal Year 2023-24, certified values from Tarrant Appraisal District
came in at 13% over prior year. The City’s collection rates for property taxes are strong
at approximately 99% annually.
114