
Page 527 - Microsoft Word - FY 2022 Adopted Budget Document
P. 527
Return to Table of Contents
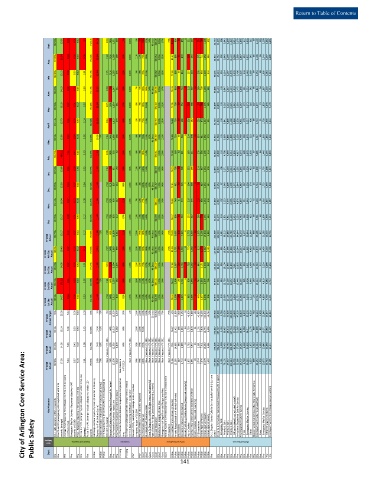
89.58% 13.92 6:05 6:01 5:22 3.7 71.61% 14.16 8.28 98% 1,331 329 17% 100% 5% 3% 53% 97% 74% 40 days $28.05 100% 87% 70% 84.74 936 62 855 3 221 407 9 132 769 1,100 407 33,739 22,078 106 5,941 4,039 11,992 9,314 5,179 4,635 317 3,803 515 69 4,420 100 2,258 2,062 6,655
Sept.
87.83% 30.54 6:14 6:06 5:20 3.06 73.24% 12.84 7.92 92% 1,269 289 30% 100% 11% 12% 73% 83% $34.34 100% 85% 81.47 885 61 870 295 433 175 711 1,458 342 35,823 23,732 102 5,949 4,259 13,422 9,186 5,569 4,687 320 3,822 545 85 4,496 59 2,240 2,197 6,098
Aug.
88.46% 13.13 6:04 5:59 5:22 2.81 76.13% 12.44 7.75 91% 1,263 375 22% 100% 9% 8% 76% 110% $34.62 100% 88% 77.93 880 45 814 257 424 203 694 1,429 412 38,135 23,113 123 6,114 4,297 12,579 3,928 5,496 7,125 316 3,440 3,369 99 4,154 68 1,905 2,181 5,543
July
89.26% 14.13 6:06 6:02 5:45 2.80 75.13% 12.32 9.28 0% 1,347 441 28% 100% 7% 5% 66% 84% 54% 46 days $55.96 100% 97% 79.18 818 48 724 0 210 507 12 269 709 1,184 361 35,885 22,413 118 6,047 4,027 12,221 3,520 5,473 4,036 281 3,213 542 96 3,841 54 1,667 2,120 5,114
June
90.39% 15.18 6:07 6:01 5:17 2.57 76.48% 11.84 8.75 93% 1,034 361 57% 100% 8% 9% 66% 125% $72.28 100% 102% 77.05 790 59 550 293 368 138 768 1,303 285 35,809 20,801 118 6,216 4,122 10,345 3,545 5,591 4,157 270 3,371 516 107 3,977 72 1,829 2,076 5,479
May
91.11% 12.79 6:11 6:03 5:39 2.14 80.34% 11.29 8.39 0% 1,013 273 43% 100% 5% 6% 79% 112% $57.53 100% 105% 76.63 759 50 486 226 287 233 674 1,417 351 32,746 21,023 116 5,841 3,806 11,260 3,866 5,538 3,901 278 3,217 406 88 3,722 91 1,728 1,903 5,023
April
92.5% 12.85 6:15 6:04 5:18 1.92 81.88% 10.95 75% 7.39 94% 1,086 166 55% 100% 8% 8% 99% 110% 60% 41 Days $92.89 100% 116% 75.89 733 46 594 4 214 378 12 330 641 1,462 273 33,613 21,548 115 5,669 3,865 11,899 3,320 5,139 3,739 238 2,978 523 78 3,547 68 1,618 1,861 5,003
Mar.
83.25% 460.12 7:11 6:49 5:46 1.73 84.49% 11.19 8.06 98% 502 82 55% 100% 8% 8% 86% 114% $70.81 100% 109% 72.93 568 40 601 163 421 203 556 1,109 214 34,610 16,990 119 4,798 3,959 8,114 2,803 4,917 6,471 398 3,070 3,003 97 5,685 84 1,446 4,155 8,818
Feb.
92.54% 13.68 6:11 6:03 4:55 2.25 83.97% 11.10 7.37 0% 651 138 58% 98% 10% 7% 146% 116% $47.70 100% 98% 79.70 705 50 506 232 295 214 637 1,334 309 30,853 19,025 106 5,271 3,404 10,244 2,941 5,392 4,035 259 3,356 420 64 3,900 77 1,755 2,068 5,921
Jan.
90.65% 12.53 6:14 6:07 5:26 2.34 80.34% 11.41 7.54 81% 807 224 86% 100% 8% 4% 182% 120% 63% 49 Days $34.87 100% 96% 77.41 661 53 525 2 194 303 9 96 643 1,339 241 30,604 18,254 97 5,348 3,609 9,200 2,572 5,644 3,987 287 3,326 374 45 3,744 82 1,723 1,939 5,800
Dec.
91.12% 18.94 6:17 6:12 5:18 2.08 82.25% 11.36 7.53 92% 903 247 71% 100% 7% 12% 77% 110% $66.10 100% 90% 78.82 748 41 570 216 375 113 656 1,334 316 27,848 19,067 107 5,220 3,575 10,165 3,070 4,876 3,613 251 2,949 413 72 3,418 59 1,516 1,843 4,987
Nov.
90.95% 13.17 6:08 6:01 5:33 2.17 80.62% 11.47 7.55 78% 602 117 87% 100% 13% 13% 104% 143% $24.99 100% 82% 78.17 899 61 530 252 327 269 778 1,335 349 32,424 21,175 114 5,801 3,921 11,339 3,414 5,230 3,784 262 3,099 423 58 3,581 63 1,600 1,918 5,314
Oct.
FY 2021 Actual 89.73% 13.17 6:15 6:07 5:24 2.17 76.68% 11.86 75% 7.98 68% 11,808 3,042 51% 100% 100% 95% 86% 109% 63% 44 days $49.09 100% 96% 70% 78.33 9,382 616 7,625 9 2,773 4,525 42 2,375 8,236 15,804 3,860 402,089 249,219 1,341 68,215 46,883 132,780 51,479 64,044 54,170 3,477 39,644 11,049 958 48,485 877 21,285 26,323 69,755
FY 2021 4th Qtr. Actual 88.6% 19.43 6:07 6:02 5:17 3.19 73.69% 13.15 7.97 94% 3,863 993 23% 100% 25% 23% 66% 96% 74% 40 days $32.55 100% 86% 70% 81.38 2,701 168 2,539 3 773 1,264 9 510 2,174 3,987 1,161 107,697 68,923 331 18,004 12,595 37,993 22,428 16,244 16,447 953 11,065 4,429 253 13,070 227 6,403 6,440 18,296
FY 2021 3rd Qtr. Actual 90.23% 14.05 6:07 6:02 5:34 2.51 77.27% 11.82 8.81 31% 3,394 1,075 43% 100% 20% 20% 70% 107% 54% 46 Days $55.07 100% 99% 77.62 2,367 157 1,760 0 729 1,162 12 640 2,151 3,904 997 104,440 64,237 352 18,104 11,955 33,826 10,931 16,602 12,094 829 9,801 1,464 291 11,540 217 5,224 6,099 15,616
FY 2021 2nd Qtr. Actual 89.29% 171.20 6:31 6:20 5:20 1.97 83.38% 11.08 75% 7.61 64% 2,239 484 56% 99% 26% 21% 110% 113% 60% 41 Days $53.16 100% 99% 76.17 2,006 136 1,701 4 609 1,094 12 747 1,834 3,905 796 99,076 57,563 340 15,738 11,228 30,257 9,064 15,448 14,245 895 9,404 3,946 239 13,132 229 4,819 8,084 19,742
FY 2021 1st Qtr. Actual 90.9% 14.77 6:13 6:06 5:26 2.20 81.04% 11.41 7.54 84% 2,312 602 81% 100% 29% 29% 121% 124% 63% 49 days $41.99 100% 89% 78.13 2,308 155 1,625 2 662 1,005 9 478 2,077 4,008 906 90,876 58,496 318 16,369 11,105 30,704 9,056 15,750 11,384 800 9,374 1,210 175 10,743 204 4,839 5,700 16,101
FY 2021 Annual Target 90% 25.00 5:20 5:00 5:20 2.00 80% 9.3 75% 8.0 95% 15,500 4,500 95% 100 100% 100% 100% 100% 50% 50 days $48.84 100% 70% 75% <70 15,000 <500 5,250 12 <3,000 3,600 <28 >1,980 <8,292 <22,400 <4,740 430,000 325,000 1,750 90,000 52,000 180,000 110,000 47,500 40,600 3,800 32,500 4,300 750 49,322 1,000 22,645 25,677 64,942
FY 2020 Actual 92.9% 15.14 6:06 5:59 5:33 1.75 83.68% 10.56 81% 44% 16,513 3,262 84% 100% 100% 301% 76.97 13,422 456 5,933 33 2,753 4,818 31 2,192 7,603 14,753 4,456 376,047 285,797 1,122 68,437 48,514 167,724 55,103 56,563 43,971 3,284 34,511 6,176 969 41,068 857 19,271 20,940 58,335
FY 2019 Actual 92.26% 14.95 5:48 5:42 5:22 1.98 81.76% 9.41 69% New Measure in FY 2021 69% 12,326 3,603 84% New Measure in FY 2021 92% 97% 155% New Measure in FY 2021 New Measure in FY 2021 New Measure in FY 2021 New Measure in FY 2021 New Measure in FY 2021 New Measure in FY 2021 New Measure in FY 2021 70.1 14,982 535 9,888 12 2,782 6,977 25 2,381 7,911 16,469 4,961 378,305 334,612 1,299 76,492 53,736 203,085 61,015 57,536
City of Arlington Core Service Area:
FY 2018 Actual 89.36% 17.90 5:44 5:37 5:18 2.61 79.65% 9.68 73% 76% 12,236 3,452 New Measure in FY 2019 99% 99% 106% 71.36 13,265 449 9,713 46 2,875 4,091 26 3,074 7,376 17,179 4,510 377,656 336,954 1,131 78,102 57,377 200,344 59,705 55,366 46,707 3,794 36,560 6,353 668 44,352 1,003 20,575 22,744 62,285
Key Measures 9‐1‐1 calls answered within 10 seconds Fire P1 and P2 (emergency) calls dispatched within 25 Average Total Response Time (Dispatch to First Unit On scene Emergency Medical Service ‐ Response objective = 300 Fires ‐ Response objective = 320 seconds or (5:20) Police E and P1 (emergency) calls dispatched within 2 minutes Police E and P1 (emergency) calls dispatched within 120 Call Response time to priority 1 calls (From Call is taken by Dispatch to F
Public Safety Goal Category seconds (average) in M:SS Format) seconds or (5:00) (average) Dispatch and Response seconds First Unit on Scene) time Prevention compared to goal of 10,804 % of Warrants Cleared Cost per Disposition 4th quarter] DWI Crashes Crime and Compliance Injury Crashes CVE Inspections Crimes Against Persons Crimes Against Property Crimes Against Society switch) Emergency Calls Priority 1 Calls Priority 2 Calls Priority
Planning
Planning
Dept.
Police
Police
Police
Police
Police
Police
Police
Police
Court
Court
Court
Court
Court
Court
Court
Court
PWT
PWT
Fire
Fire
Fire
Fire
Fire
Fire
Fire
Fire
Fire
Fire
141 Police Police Police Police Police Police Police Fire Fire Fire Fire Fire Fire Fire Fire Fire Fire Fire Fire Fire Fire Fire Fire Fire Fire