
Page 103 - Watauga FY21 Budget
P. 103
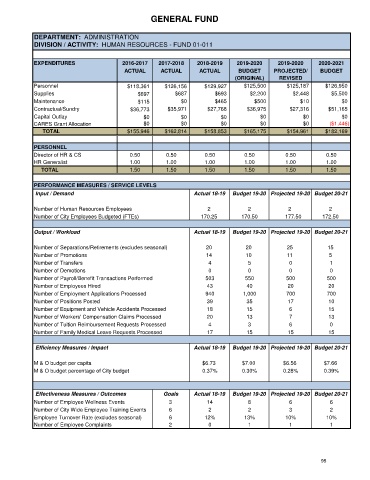
GENERAL FUND


          DEPARTMENT:  ADMINISTRATION
          DIVISION / ACTIVITY:  HUMAN RESOURCES - FUND 01-011


          EXPENDITURES                 2016-2017   2017-2018    2018-2019    2019-2020     2019-2020    2020-2021
                                        ACTUAL      ACTUAL       ACTUAL      BUDGET      PROJECTED/      BUDGET
                                                                            (ORIGINAL)     REVISED
          Personnel                      $118,361    $126,156     $129,927     $125,500      $125,187     $126,950
          Supplies                          $697         $687         $693       $2,200        $2,448       $5,500
          Maintenance                       $115           $0         $465         $500           $10           $0
          Contractual/Sundry              $36,773     $35,971      $27,768      $36,975       $27,316      $51,165
          Capital Outlay                      $0           $0           $0           $0            $0           $0
          CARES Grant Allocation              $0           $0           $0           $0            $0       ($1,446)
                TOTAL                    $155,946    $162,814     $158,853     $165,175      $154,961     $182,169

          PERSONNEL
          Director of HR & CS             0.50        0.50        0.50         0.50          0.50          0.50
          HR Generalist                   1.00        1.00        1.00         1.00          1.00          1.00
               TOTAL                      1.50        1.50        1.50         1.50          1.50          1.50

          PERFORMANCE MEASURES / SERVICE LEVELS
           Input / Demand                                      Actual 18-19  Budget 19-20 Projected 19-20 Budget 20-21

          Number of Human Resources Employees                      2             2            2            2
          Number of City Employees Budgeted (FTEs)               170.25       170.50         177.50      172.50


          Output / Workload                                    Actual 18-19  Budget 19-20 Projected 19-20 Budget 20-21

          Number of Separations/Retirements (excludes seasonal)    20           20            25           15
          Number of Promotions                                     14           10            11           5
          Number of Transfers                                       4            5            0             1
          Number of Demotions                                       0            0            0             0
          Number of Payroll/Benefit Transactions Performed         503          550          500           500
          Number of Employees Hired                                43           40            20           20
          Number of Employment Applications Processed              940         1,000         700           700
          Number of Positions Posted                               39           35            17           10
          Number of Equipment and Vehicle Accidents Processed      18           15            6            15
          Number of Workers' Compensation Claims Processed         20           13            7            13
          Number of Tuition Reimbursement Requests Processed        4            3            6             0
          Number of Family Medical Leave Requests Processed        17           15            15           15


           Efficiency Measures / Impact                        Actual 18-19  Budget 19-20 Projected 19-20 Budget 20-21

          M & O budget per capita                                 $6.73        $7.00        $6.56         $7.66
          M & O budget percentage of City budget                  0.37%        0.30%        0.28%         0.39%


           Effectiveness Measures / Outcomes         Goals     Actual 18-19  Budget 19-20 Projected 19-20 Budget 20-21
          Number of Employee Wellness Events           3           14            8            6             6
          Number of City Wide Employee Training Events  6           2            2            3             2
          Employee Turnover Rate (excludes seasonal)   6          12%          13%           10%           10%
          Number of Employee Complaints                2            0            1            1             1


                                                                                                         95