
Page 272 - N. Richland Hills General Budget
P. 272
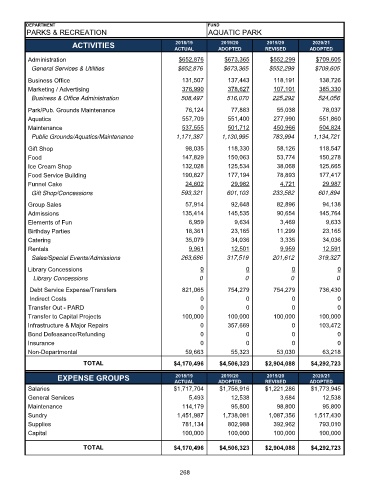
DEPARTMENT                                                  FUND
          PARKS & RECREATION                                          AQUATIC PARK
                         ACTIVITIES                        2018/19        2019/20        2019/20        2020/21
                                                           ACTUAL        ADOPTED         REVISED       ADOPTED
           Administration                                   $652,876       $673,365       $552,299        $709,605
             General Services & Utilities                   $652,876       $673,365       $552,299       $709,605

           Business Office                                   131,507        137,443         118,191        138,726
           Marketing / Advertising                           376,990        378,627         107,101        385,330
             Business & Office Administration                508,497        516,070        225,292        524,056
           Park/Pub. Grounds Maintenance                      76,124         77,883          55,038         78,037
           Aquatics                                          557,709        551,400         277,990        551,860
           Maintenance                                       537,555        501,712         450,966        504,824
             Public Grounds/Aquatics/Maintenance           1,171,387      1,130,995        783,994       1,134,721
           Gift Shop                                          98,035        118,330          58,126        118,547
           Food                                              147,829        150,063          53,774        150,278
           Ice Cream Shop                                    132,028        125,534          38,068        125,665
           Food Service Building                             190,827        177,194          78,893        177,417
           Funnel Cake                                        24,602         29,982           4,721         29,987
             Gift Shop/Concessions                           593,321        601,103        233,582        601,894
           Group Sales                                        57,914         92,648          82,896         94,138
           Admissions                                        135,414        145,535          90,654        145,764
           Elements of Fun                                     6,959           9,634          3,469          9,633
           Birthday Parties                                   18,361         23,165          11,299         23,165
           Catering                                           35,079         34,036           3,335         34,036
           Rentals                                             9,961         12,501           9,959         12,591
             Sales/Special Events/Admissions                 263,686        317,519        201,612        319,327

           Library Concessions                                     0              0               0              0
              Library Concessions                                  0              0              0              0
            Debt Service Expense/Transfers                   821,065        754,279         754,279        736,430
           I  n  d  i  r  e  c  t     C  o  s  t  s                0              0               0              0
          T  r  a  n  s  f  e  r     O  u  t     -     P  A  R  D  0              0               0              0
           Transfer to Capital Projects                      100,000        100,000        100,000         100,000
           Infrastructure & Major Repairs                          0        357,669               0        103,472
           Bond Defeasance/Refunding                               0              0               0              0
          I  n  s  u  r  a  n  c  e                                0              0               0              0
           Non-Departmental                                   59,663         55,323          53,030         63,218
                             TOTAL                        $4,170,496      $4,506,323     $2,904,088     $4,292,723

                    EXPENSE GROUPS                         2018/19        2019/20        2019/20        2020/21
                                                           ACTUAL        ADOPTED         REVISED       ADOPTED
           Salaries                                        $1,717,704     $1,756,916     $1,221,286     $1,773,945
           General Services                                    5,493         12,538           3,684         12,538
           Maintenance                                       114,179         95,800          98,800         95,800
           Sundry                                           1,451,987      1,738,081      1,087,356      1,517,430
           Supplies                                          781,134        802,988         392,962        793,010
           Capital                                           100,000        100,000        100,000         100,000


                             TOTAL                         $4,170,496     $4,506,323     $2,904,088     $4,292,723


                                                             268