
Page 275 - N. Richland Hills General Budget
P. 275
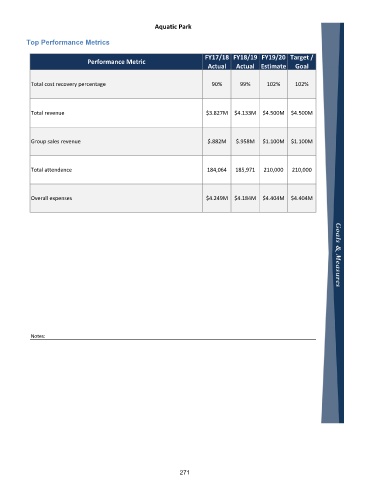
Aquatic Park

          Top Performance Metrics

                                                                     FY17/18  FY18/19  FY19/20  Target /
                              Performance Metric
                                                                      Actual   Actual Estimate     Goal


           Total cost recovery percentage                              90%      99%      102%      102%


           Total revenue                                             $3.827M   $4.133M  $4.500M  $4.500M


           Group sales revenue                                        $.882M   $.958M   $1.100M  $1.100M


           Total attendance                                           184,064  185,971  210,000   210,000


           Overall expenses                                          $4.249M   $4.184M  $4.404M  $4.404M


           Notes:


                                                             271