
Page 247 - Manfield FY21 Budget
P. 247
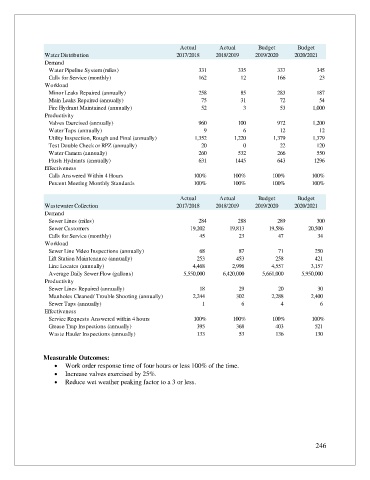
Actual       Actual      Budget       Budget
                Water Distribution                         2017/2018    2018/2019    2019/2020    2020/2021
                Demand
                   Water Pipeline System (miles)                   331          335          337          345
                   Calls for Service (monthly)                     162           12          166           23
                Workload
                   Minor Leaks Repaired (annually)                 258           85          283          187
                   Main Leaks Repaired (annually)                   75           31           72           54
                   Fire Hydrant Maintained (annually)               52            3           53        1,000
                Productivity
                   Valves Exercised (annually)                     960          100          972        1,200
                   Water Taps (annually)                            9             6           12           12
                   Utility Inspection, Rough and Final (annually)  1,352      1,220        1,379        1,379
                   Test Double Check or RPZ (annually)              20            0           22          120
                   Water Camera (annually)                         260          532          266          550
                   Flush Hydrants (annually)                       631         1445          643         1296
                Effectiveness
                   Calls Answered Within 4 Hours                 100%         100%         100%         100%
                   Percent Meeting Monthly Standards             100%         100%         100%         100%

                                                             Actual       Actual      Budget       Budget
                Wastewater Collection                      2017/2018    2018/2019    2019/2020    2020/2021
                Demand
                   Sewer Lines (miles)                             284          288          289          300
                   Sewer Customers                                        19,202                 19,813                 19,586                 20,500


                   Calls for Service (monthly)                                  45                        23                          47                          34
                Workload


                   Sewer Line Video Inspections (annually)                          68                          87                        71                      250


                   Lift Station Maintenance (annually)                        253                        453                      258                        421
                   Line Locates (annually)                                   4,468                     2,996                     4,557                   3,157

                   Average Daily Sewer Flow (gallons)                5,550,000            6,420,000            5,661,000            5,950,000
                Productivity

                   Sewer Lines Repaired (annually)                              18                          29                        20                        30


                   Manholes Cleaned/ Trouble Shooting (annually)                     2,244                      302                   2,288                     2,400

                   Sewer Taps (annually)                                          1                              6                            4                          6
                Effectiveness
                   Service Requests Answered within 4 hours      100%         100%         100%         100%


                   Grease Trap Inspections (annually)                         395                      368                      403                      521


                   Waste Hauler Inspections (annually)                        133                          53                      136                        130


               Measurable Outcomes:
                   •  Work order response time of four hours or less 100% of the time.
                   •  Increase valves exercised by 25%.
                   •  Reduce wet weather peaking factor to a 3 or less.


                                                                                                         246