
Page 250 - Manfield FY21 Budget
P. 250
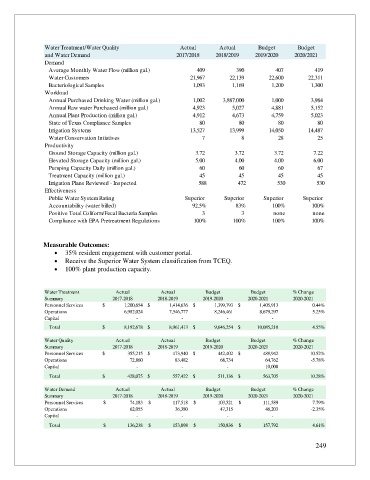
Water Treatment/Water Quality                Actual       Actual      Budget       Budget
                and Water Demand                           2017/2018    2018/2019    2019/2020    2020/2021
                Demand
                   Average Monthly Water Flow (million gal.)                       409                      390                      407                      419

                   Water Customers                                       21,967                 22,139                   22,600                 22,311


                   Bacteriological Samples                                  1,093                   1,169                   1,200                   1,300
                Workload
                   Annual Purchased Drinking Water (million gal.)                    1,002  3,887.000  1,000  3,984
                   Annual Raw water Purchased (million gal.)                    4,923                   5,027                   4,881                   5,152
                   Annual Plant Production (million gal.)                    4,912  4,673                   4,759                   5,023
                   State of Texas Compliance Samples                             80                        80                        80                        80
                   Irrigation Systems                                     13,527                 13,999                 14,050                 14,487
                   Water Conservation Intiatives                                  7                            8                            28                        25

                Productivity
                   Ground Storage Capacity (million gal.)                     3.72                       3.72                       3.72                       7.22


                   Elevated Storage Capacity (million gal.)                     5.00                       4.00                     4.00                       6.00

                   Pumping Capacity Daily (million gal.)                        60                          60                          60                          67


                   Treatment Capacity (million gal.)                            45                          45                        45                        45
                   Irrigation Plans Reviewed - Inspected           588          472          530          530
                Effectiveness
                   Public Water System Rating                 Superior     Superior     Superior     Superior
                   Accountability (water billed)                 92.5%         83%         100%         100%
                   Positive Total Coliform/Fecal Bacteria Samples                            3                            3  none  none
                   Compliance with EPA Pretreatment Regulations  100%         100%         100%         100%


               Measurable Outcomes:
                   •  35% resident engagement with customer portal.
                   •  Receive the Superior Water System classification from TCEQ.
                   •  100% plant production capacity.


                Water Treatment        Actual         Actual         Budget         Budget        % Change
                Summary               2017-2018      2018-2019      2019-2020      2020-2021      2020-2021
                Personnel Services  $                  1,200,654 $                  1,414,636 $                  1,399,793 $                  1,405,913  0.44%
                Operations                             6,982,024                     7,546,777                     8,246,461                     8,679,297  5.25%
                Capital                                           -                                 -                                 -                                 -
                 Total             $                  8,182,678 $                  8,961,413 $                  9,646,254 $                10,085,210  4.55%

                Water Quality          Actual         Actual         Budget         Budget        % Change
                Summary               2017-2018      2018-2019      2019-2020      2020-2021      2020-2021
                Personnel Services  $                     355,215 $                     473,940 $                     442,402 $                     488,942  10.52%
                Operations                                  72,860                          83,482                          68,734                          64,762  -5.78%
                Capital                                           -                                 -                                 -                           10,000
                 Total             $                     428,075 $                     557,422 $                     511,136 $                     563,705  10.28%

                Water Demand           Actual         Actual         Budget         Budget        % Change
                Summary               2017-2018      2018-2019      2019-2020      2020-2021      2020-2021

                Personnel Services  $                        74,183  $                      117,518  $                    103,521  $                    111,589  7.79%

                Operations                                   62,055                          36,380                            47,315                          46,203  -2.35%


                Capital                                           -                                 -                                 -                                 -
                 Total             $                      136,238  $                      153,898  $                    150,836  $                      157,792  4.61%

                                                                                                         249