
Page 244 - Manfield FY21 Budget
P. 244
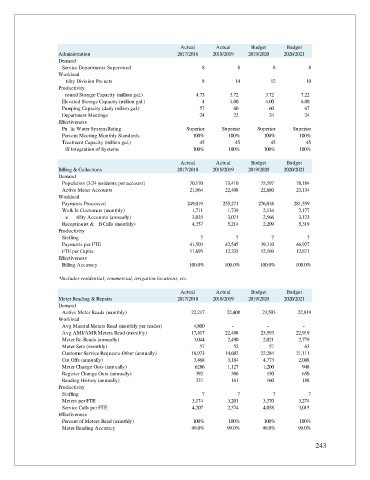
Actual     Actual      Budget      Budget
                    Administration                          2017/2018  2018/2019   2019/2020   2020/2021
                    Demand
                       Service Departments Supervised               8           8          8           8
                    Workload
                       Utility Division Projects                    8          14          12         10
                    Productivity
                       Ground Storage Capacity (million gal.)     4.75                     3.72                      3.72                      7.22
                       Elevated Storage Capacity (million gal.)     4                     4.00                      4.00                      6.00
                       Pumping Capacity (daily million gal.)       57                        60                         60                         67
                       Department Meetings                         24                        22                         24                         24
                    Effectiveness
                       Public Water System Rating              Superior   Superior    Superior    Superior
                       Percent Meeting Monthly Standards         100%        100%       100%        100%
                       Treatment Capacity (million gal.)           45          45          45         45
                       GIS Integration of Systems                100%        100%       100%        100%

                                                             Actual     Actual      Budget      Budget
                    Billing & Collections                   2017/2018  2018/2019   2019/2020   2020/2021
                    Demand
                       Population (3.24 residents per account)                  70,170                 73,410                 75,597                 78,184
                       Active Meter Accounts                              21,964                 22,408                 22,680                 23,134
                    Workload
                       Payments Processed                      249,019     255,271    276,038     281,559
                       Walk In Customers (monthly)               1,711      1,739       2,134       2,177
                       New Utility Accounts (annually)*                     3,035                   3,071                   2,566                   3,123
                       Receptionist & UB Calls (monthly)         4,357      5,214       2,209       5,319
                    Productivity
                       Staffing                                                    7                           7                           7                           7
                       Payments per FTE                         41,503      42,545     39,310      46,927
                       FTE per Capita                           11,695      12,235     12,169      12,871
                    Effectiveness
                       Billing Accuracy                         100.0%     100.0%      100.0%      100.0%

                    *Includes residential, commercial, irrigation locations, etc.

                                                             Actual     Actual      Budget      Budget
                    Meter Reading & Repairs                 2017/2018  2018/2019   2019/2020   2020/2021
                    Demand
                       Active Meter Reads (monthly)             22,217      22,408      23,593      22,919
                    Workload
                       Avg Manual Meters Read (monthly per reader)  4,800                       -                        -                        -
                       Avg AMI/AMR Meters Read (monthly)        17,417                 22,408                  23,593                  22,919
                       Meter Re-Reads (annually)                 3,044                   2,490                    2,021                    2,779
                       Meter Sets (monthly)                        57                        52                         57                         63
                       Customer Service Requests-Other (annually)  18,973                 14,682                  22,284                  21,111
                       Cut Offs (annually)                       3,468                   3,184                    4,773                    2,088
                       Meter Change Outs (annually)              6286                   1,127                    1,200                       948
                       Register Change Outs (annually)            392                       306                       150                       650
                       Reading History (annually)                 327                       161                       160                       188
                    Productivity
                       Staffing                                     7           7          7           7
                       Meters per FTE                            3,174      3,201       3,370       3,274
                       Service Calls per FTE                     4,207      2,374       4,058       3,015
                    Effectiveness
                       Percent of Meters Read (monthly)          100%        100%       100%        100%
                       Meter Reading Accuracy                   99.0%       99.0%       99.0%       99.0%

                                                                                                         243