
Page 82 - Grapevine Budget FY21
P. 82
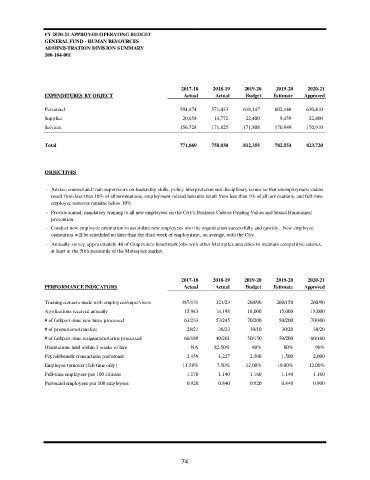
FY 2020-21 APPROVED OPERATING BUDGET
                GENERAL FUND - HUMAN RESOURCES
                ADMINISTRATION DIVISION SUMMARY
                100-104-001


                                                             2017-18   2018-19    2019-20   2019-20    2020-21
                EXPENDITURES BY OBJECT                        Actual    Actual    Budget   Estimate   Approved

                Personnel                                         594,474           571,433           618,147           602,146           630,410
                Supplies                                            20,658             14,772             22,400               9,459             22,400
                Services                                          156,728           171,825           171,808           170,949           170,910

                Total                                             771,860           758,030           812,355           782,554           823,720


                OBJECTIVES

                - Advise, counsel and train supervisors on leadership skills, policy interpretation and disciplinary issues so that unemployment claims
                  result from less than 10% of all terminations, employment-related lawsuits result from less than 1% of all terminations, and full-time
                  employee turnover remains below 10%.
                - Provide annual, mandatory training to all new employees on the City's Business Culture Guiding Values and Sexual Harassment
                  prevention.
                - Conduct new employee orientation to assimilate new employees into the organization successfully and quickly.  New employee
                  orientation will be scheduled no later than the third week of employment, on average, with the City.
                - Annually survey approximately 40 of Grapevine's benchmark jobs with other Metroplex area cities to maintain competitive salaries,
                  at least at the 50th percentile of the Metroplex market.


                                                             2017-18   2018-19    2019-20   2019-20    2020-21
                PERFORMANCE INDICATORS                        Actual    Actual    Budget   Estimate   Approved


                Training contacts made with employees/supervisors  387/131  321/23  260/90  260/150     260/90
                Applications received annually                15,943    14,198     18,000    15,000     18,000
                # of full/part-time new hires processed       63/233    53/245     70/200    50/200     70/300
                # of promotions/transfers                      28/21     38/23      30/10     30/20      30/20
                # of full/part-time resignations/terms processed  66/189  40/201   50/150    50/200     60/160
                Orientations held within 3 weeks of hire        NA      82.50%      80%        80%       90%
                Payroll/benefit transactions performed         2,459     1,227      2,500     1,500      2,000
                Employee turnover (full-time only)           11.58%      7.50%    12.00%     10.00%    12.00%
                Full-time employees per 100 citizens           1.170     1.140      1.160     1.140      1.160
                Personnel employees per 100 employees          0.920     0.840      0.920     0.840      0.900


                                                             74