
Page 146 - Grapevine Budget FY21
P. 146
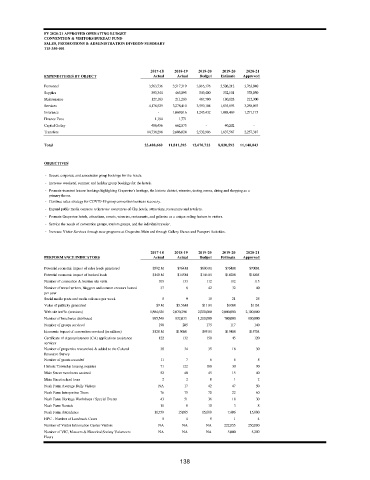
FY 2020-21 APPROVED OPERATING BUDGET
                CONVENTION & VISITORS BUREAU FUND
                SALES, PROMOTIONS & ADMINISTRATION DIVISION SUMMARY
                115-350-001


                                                   2017-18  2018-19  2019-20  2019-20  2020-21
                EXPENDITURES BY OBJECT              Actual  Actual  Budget  Estimate  Approved
                Personnel                               3,563,736         3,517,319         3,916,176         3,506,212         3,763,040
                Supplies                                  393,344           463,895           549,400           332,101           378,050
                Maintenance                               127,103           211,283           467,700           180,128           212,300
                Services                                4,178,529         3,278,410         3,959,108         1,835,893         3,258,093
                Insurance                                        -          1,069,816         1,245,432         1,088,469         1,271,173
                Finance Fees                                  1,194               1,771                  -                   -                   -
                Capital Outlay                            486,456           662,875                  -              40,202                  -
                Transfers                             14,738,298         2,606,024         2,532,906         1,837,587         2,257,387


                Total                                23,488,660     11,811,393     12,670,722       8,820,592       11,140,043

                OBJECTIVES

                - Secure corporate and association group bookings for the hotels.
                - Increase weekend, summer and holiday group bookings for the hotels.
                - Promote transient leisure bookings highlighting Grapevine's heritage, the historic district, wineries, tasting rooms, dining and shopping as a
                 primary theme.
                - Continue sales strategy for COVID-19 group convention business recovery.
                - Expand public media contacts to increase awareness of City hotels, attractions, restaurants and retailers.
                - Promote Grapevine hotels, attractions, events, wineries, restaurants, and galleries as a unique selling feature to visitors.
                - Service the needs of convention groups, tourism groups, and the individual traveler.
                - Increase Visitor Services through new programs at Grapevine Main and through Gallery Shows and Passport Activities.


                                                   2017-18  2018-19  2019-20  2019-20  2020-21
                PERFORMANCE INDICATORS              Actual  Actual  Budget  Estimate  Approved
                Potential economic impact of sales leads generated   $592 M  $764M  $600 M  $764M  $700M
                Potential economic impact of booked leads        $140 M  $145M  $146 M  $142M  $148M
                Number of convention & tourism site visits  105  133  112    112     115
                Number of travel writers, bloggers and content creators hosted   37  6  42  32  40
                per year
                Social media posts and media releases per week  5  9  15      21      25
                Value of publicity generated         $9 M  $5.56M   $11 M   $10M    $11M
                Web site traffic (sessions)        1,884,626         2,070,294  2,000,000  2,000,000  2,100,000
                Number of brochures distributed     985,549           832,033  1,200,000  700,000  900,000
                Number of groups serviced             190    205     175     117     140
                Economic impact of convention serviced (in millions)  $128 M  $150M  $95 M  $134M  $157M
                Certificate of Appropriateness (CA) applications assistance   122  132  150  45  120
                services
                Number of properties researched & added to the Cultural   38  34  35  16  30
                Resource Survey
                Number of grants awarded              11       7      6       6       5
                Historic Township housing inquiries   71     122     100      30      90
                Main Street merchants assisted        52      40      45      15      40
                Main Street school tours               2       2      8       1       2
                Nash Farm Average Daily Visitors     NA       17      42      47      50
                Nash Farm Interpretive Tours          76      75      70      22      60
                Nash Farm Heritage Workshops / Special Events  43  51  36     18      30
                Nash Farm Rentals                     10       8      10      3       8
                Nash Farm Attendance                11,759  15,085  15,000  7,406   15,000
                HPC - Number of Landmark Cases         5       4      5       1       4
                Number of Visitor Information Center Visitors  NA  NA  NA  222,855  250,000
                Number of VIC, Musuem & Historical Society Volunteers   NA  NA  NA  5,000  5,200
                Hours


                                                             138