
Page 122 - Southlake FY20 Budget
P. 122
City Profile
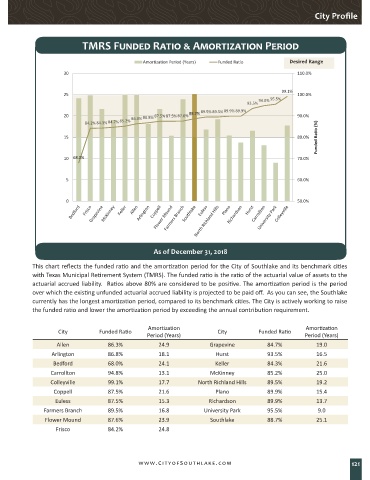
TMRS Funded Ratio & Amortization Period
Amortization Period (Years) Funded Ratio Desired Range
30 110.0%
99.1%
25 100.0%
94.8% 95.5%
93.5%
88.7% 89.5% 89.5% 89.9% 89.9%
20 86.3% 86.8% 87.5% 87.5% 87.6% 90.0%
84.2% 84.3% 84.7% 85.2%
Funded Ratio (%)
15 80.0%
10 68.0% 70.0%
5 60.0%
0 50.0%
Population
As of December 31, 2018 FTEs
This chart reflects the funded ratio and the amortization period for the City of Southlake and its benchmark cities
with Texas Municipal Retirement System (TMRS). The funded ratio is the ratio of the actuarial value of assets to the
actuarial accrued liability. Ratios above 80% are considered to be positive. The amortization period is the period
over which the existing unfunded actuarial accrued liability is projected to be paid off. As you can see, the Southlake
currently has the longest amortization period, compared to its benchmark cities. The City is actively working to raise
the funded ratio and lower the amortization period by exceeding the annual contribution requirement.
Amortization Amortization
City Funded Ratio City Funded Ratio
Period (Years) Period (Years)
Allen 86.3% 24.9 Grapevine 84.7% 19.0
Arlington 86.8% 18.1 Hurst 93.5% 16.5
Bedford 68.0% 24.1 Keller 84.3% 21.6
Carrollton 94.8% 13.1 McKinney 85.2% 25.0
Colleyville 99.1% 17.7 North Richland Hills 89.5% 19.2
Coppell 87.5% 21.6 Plano 89.9% 15.4
Euless 87.5% 15.3 Richardson 89.9% 13.7
Farmers Branch 89.5% 16.8 University Park 95.5% 9.0
Flower Mound 87.6% 23.9 Southlake 88.7% 25.1
Frisco 84.2% 24.8
www.CityofSouthlake.com 121