Page 119 - Southlake FY20 Budget
P. 119

City Profile


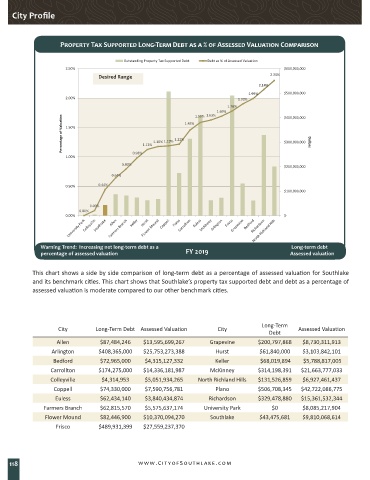
                     Property Tax Supported Long-Term Debt as a % of Assessed Valuation Comparison


                                          Outstanding Property Tax Supported Debt  Debt as % of Assessed Valuation
                       2.50%                                                                    $600,000,000
                                  Desired Range                                           2.30%
                                                                                       2.14%
                                                                                   1.99%        $500,000,000
                       2.00%                                                    1.90%
                                                                            1.78%
                                                                         1.69%                  $400,000,000
                                                                  1.59% 1.63%
                      Percentage of Valuation  1.50%  1.13%  1.18% 1.19%  1.22%  1.45%          $300,000,000  Dollars


                       1.00%                 0.98%
                                         0.80%
                                                                                                $200,000,000
                                      0.64%
                       0.50%      0.44%
                                                                                                $100,000,000

                               0.09%
                           0.00%
                       0.00%                                                                    $-


              Warning Trend:  Increasing net long-term debt as a                                    Long-term debt
              percentage of assessed valuation                     FY 2019                         Assessed valuation

            This chart shows a side by side comparison of long-term debt as a percentage of assessed valuation for Southlake
            and its benchmark cities. This chart shows that Southlake’s property tax supported debt and debt as a percentage of
            assessed valuation is moderate compared to our other benchmark cities.


                                                                                        Long-Term
                    City         Long-Term Debt Assessed Valuation       City                       Assessed Valuation
                                                                                          Debt
                    Allen         $87,484,246   $13,595,699,267       Grapevine       $200,797,868   $8,730,311,913
                  Arlington       $408,365,000  $25,753,273,388         Hurst          $61,840,000   $3,103,842,101
                   Bedford        $72,965,000    $4,315,127,332         Keller          $68,019,894    $5,788,817,005
                  Carrollton      $174,275,000  $14,336,181,987        McKinney       $314,198,391   $21,663,777,033
                  Colleyville      $4,314,953    $5,051,934,265    North Richland Hills  $131,526,859  $6,927,461,437
                   Coppell        $74,330,000    $7,590,756,781         Plano         $506,708,345   $42,722,086,775
                   Euless         $62,434,140    $3,840,434,874       Richardson      $329,478,880   $15,361,532,344
                Farmers Branch    $62,815,570    $5,575,637,174     University Park        $0        $8,085,217,904
                Flower Mound      $82,446,900   $10,370,094,270        Southlake       $43,475,681   $9,810,068,614
                   Frisco         $489,931,399  $27,559,237,370


    118                                        www.CityofSouthlake.com
   114   115   116   117   118   119   120   121   122   123   124