
Page 118 - Southlake FY20 Budget
P. 118
City Profile
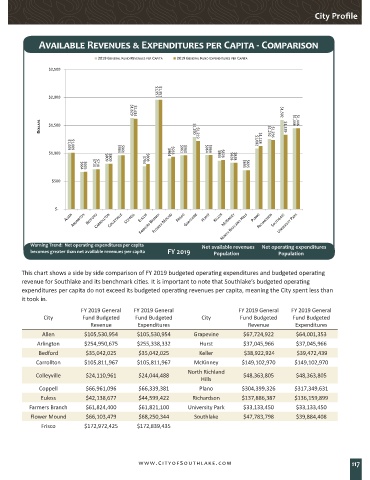
Available Revenues & Expenditures per Capita - Comparison
2019 GENERAL FUND REVENUES PER CAPITA 2019 GENERAL FUND EXPENDITURES PER CAPITA
$2,500
$2,000 $1,629 $1,957 $1,957
DOLLARS $1,500 $1,614 $1,290 $1,219 $1,128 $1,252 $1,236 $1,592 $1,329 $1,446 $1,446
$1,000 $1,009 $1,009 $664 $665 $710 $710 $809 $809 $964 $961 $764 $808 $904 $933 $961 $960 $964 $964 $866 $878 $828 $828 $695 $695 $1,082
$500
$-
Warning Trend: Net operating expenditures per capita Net available revenues Net operating expenditures
becomes greater than net available revenues per capita FY 2019 Population Population
This chart shows a side by side comparison of FY 2019 budgeted operating expenditures and budgeted operating
revenue for Southlake and its benchmark cities. It is important to note that Southlake’s budgeted operating
expenditures per capita do not exceed its budgeted operating revenues per capita, meaning the City spent less than
it took in.
FY 2019 General FY 2019 General FY 2019 General FY 2019 General
City Fund Budgeted Fund Budgeted City Fund Budgeted Fund Budgeted
Revenue Expenditures Revenue Expenditures
Allen $105,530,954 $105,530,954 Grapevine $67,724,922 $64,001,353
Arlington $254,950,675 $255,338,332 Hurst $37,045,966 $37,045,966
Bedford $35,042,025 $35,042,025 Keller $38,922,924 $39,472,439
Carrollton $105,811,967 $105,811,967 McKinney $149,102,970 $149,102,970
North Richland
Colleyville $24,110,961 $24,044,488 $48,363,805 $48,363,805
Hills
Coppell $66,961,096 $66,339,381 Plano $304,399,326 $317,349,631
Euless $42,138,677 $44,599,422 Richardson $137,886,387 $136,159,899
Farmers Branch $61,824,400 $61,821,100 University Park $33,133,450 $33,133,450
Flower Mound $66,103,479 $68,250,344 Southlake $47,783,798 $39,884,408
Frisco $172,972,425 $172,839,435
www.CityofSouthlake.com 117