
Page 117 - Southlake FY20 Budget
P. 117
City Profile
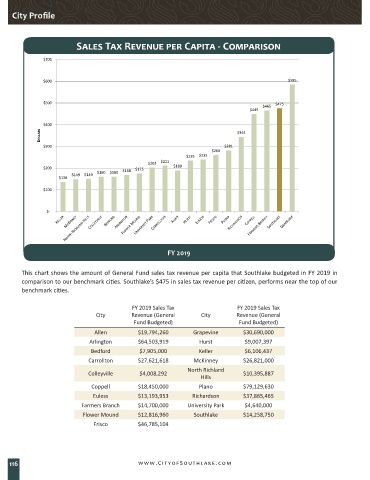
Sales Tax Revenue per Capita - Comparison
$700
$600 $585
$500 $475
$465
$449
$400
DOLLARS $344
$300 $281
$260
$235 $239
$203 $211
$200 $175 $189
$160 $160 $168
$149 $149
$136
$100
$-
FY 2019
This chart shows the amount of General Fund sales tax revenue per capita that Southlake budgeted in FY 2019 in
comparison to our benchmark cities. Southlake’s $475 in sales tax revenue per citizen, performs near the top of our
benchmark cities.
FY 2019 Sales Tax FY 2019 Sales Tax
City Revenue (General City Revenue (General
Fund Budgeted) Fund Budgeted)
Allen $19,794,260 Grapevine $30,690,000
Arlington $64,503,919 Hurst $9,007,397
Bedford $7,905,000 Keller $6,106,437
Carrollton $27,621,618 McKinney $26,821,000
North Richland
Colleyville $4,008,292 $10,395,887
Hills
Coppell $18,450,000 Plano $79,129,630
Euless $13,193,953 Richardson $37,865,465
Farmers Branch $14,700,000 University Park $4,640,000
Flower Mound $12,816,960 Southlake $14,258,750
Frisco $46,785,104
116 www.CityofSouthlake.com