
Page 112 - Southlake FY20 Budget
P. 112
City Profile
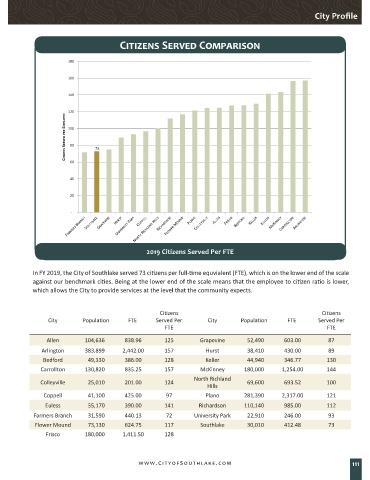
Citizens Served Comparison
180
160
140
120
CITIZENS SERVED PER EMPLOYEE 100 73
80
60
40
20
-
Population
2019 Citizens Served Per FTE FTEs
In FY 2019, the City of Southlake served 73 citizens per full-time equvialent (FTE), which is on the lower end of the scale
against our benchmark cities. Being at the lower end of the scale means that the employee to citizen ratio is lower,
which allows the City to provide services at the level that the community expects.
Citizens Citizens
City Population FTE Served Per City Population FTE Served Per
FTE FTE
Allen 104,636 838.96 125 Grapevine 52,490 603.00 87
Arlington 383,899 2,442.00 157 Hurst 38,410 430.00 89
Bedford 49,330 386.00 128 Keller 44,940 346.77 130
Carrollton 130,820 835.25 157 McKinney 180,000 1,254.00 144
North Richland
Colleyville 25,010 201.00 124 69,600 693.52 100
Hills
Coppell 41,100 425.00 97 Plano 281,390 2,317.00 121
Euless 55,170 390.00 141 Richardson 110,140 985.00 112
Farmers Branch 31,590 440.13 72 University Park 22,910 246.00 93
Flower Mound 73,130 624.75 117 Southlake 30,010 412.48 73
Frisco 180,000 1,411.50 128
www.CityofSouthlake.com 111