
Page 111 - Southlake FY20 Budget
P. 111
City Profile
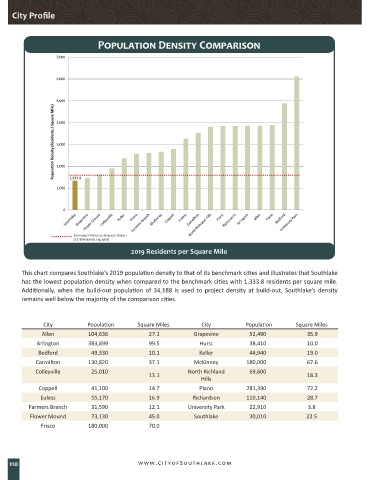
Population Density Comparison
7,000
6,000
5,000
Population Density (Residents / Square Mile) 4,000
3,000
2,000
1,000 1,333.8
0
SOUTHLAKE'S PROJECTED BUILDOUT DENSITY
(1519 RESIDENTS / SQ MILE)
2019 Residents per Square Mile
This chart compares Southlake’s 2019 population density to that of its benchmark cities and illustrates that Southlake
has the lowest population density when compared to the benchmark cities with 1,333.8 residents per square mile.
Additionally, when the build-out population of 34,188 is used to project density at build-out, Southlake’s density
remains well below the majority of the comparison cities.
City Population Square Miles City Population Square Miles
Allen 104,636 27.1 Grapevine 52,490 35.9
Arlington 383,899 99.5 Hurst 38,410 10.0
Bedford 49,330 10.1 Keller 44,940 19.0
Carrollton 130,820 37.1 McKinney 180,000 67.6
Colleyville 25,010 North Richland 69,600
13.1 18.3
Hills
Coppell 41,100 14.7 Plano 281,390 72.2
Euless 55,170 16.9 Richardson 110,140 28.7
Farmers Branch 31,590 12.1 University Park 22,910 3.8
Flower Mound 73,130 45.0 Southlake 30,010 22.5
Frisco 180,000 70.0
110 www.CityofSouthlake.com