
Page 254 - Mansfieldr FY20 Approved Budget
P. 254
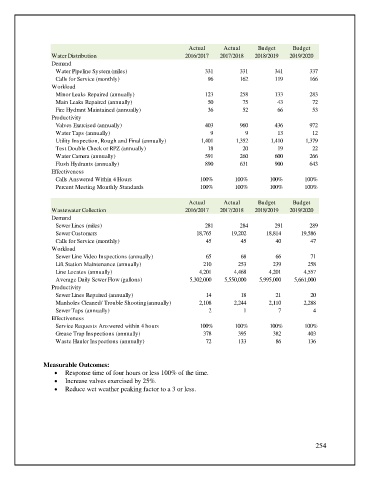
Actual      Actual     Budget      Budget
                  Water Distribution                          2016/2017   2017/2018  2018/2019   2019/2020
                  Demand
                     Water Pipeline System (miles)                   331        331         341        337
                     Calls for Service (monthly)                      96        162         119        166
                  Workload
                     Minor Leaks Repaired (annually)                 123        258         133        283
                     Main Leaks Repaired (annually)                   50         75          43         72
                     Fire Hydrant Maintained (annually)               36         52          66         53
                  Productivity
                     Valves Exercised (annually)                     403        960         436        972
                     Water Taps (annually)                             9          9          13         12
                     Utility Inspection, Rough and Final (annually)  1,401     1,352       1,410      1,379
                     Test Double Check or RPZ (annually)              18         20          19         22
                     Water Camera (annually)                         591        260         600        266
                     Flush Hydrants (annually)                       890        631         900        643
                  Effectiveness
                     Calls Answered Within 4 Hours                 100%        100%       100%        100%
                     Percent Meeting Monthly Standards             100%        100%       100%        100%

                                                               Actual      Actual     Budget      Budget
                  Wastewater Collection                       2016/2017   2017/2018  2018/2019   2019/2020
                  Demand
                     Sewer Lines (miles)                             281        284         291        289
                     Sewer Customers                                       18,765             19,202             18,814             19,586
                     Calls for Service (monthly)                                  45                      45                      40                      47
                  Workload
                     Sewer Line Video Inspections (annually)                      65                    68                    66                      71


                     Lift Station Maintenance (annually)                        210                    253                  239                    258


                     Line Locates (annually)                                 4,201               4,468                 4,201               4,557
                     Average Daily Sewer Flow (gallons)               5,302,000        5,550,000        5,995,000        5,661,000
                  Productivity


                     Sewer Lines Repaired (annually)                            14                    18                    21                      20

                     Manholes Cleaned/ Trouble Shooting(annually)                 2,108               2,244                 2,110               2,288


                     Sewer Taps (annually)                                        2                      1                      7                        4


                  Effectiveness
                     Service Requests Answered within 4 hours      100%        100%       100%        100%


                     Grease Trap Inspections (annually)                       378                    395                  382                    403
                     Waste Hauler Inspections (annually)                          72                    133                      86                    136


               Measurable Outcomes:
                   •  Response time of four hours or less 100% of the time.
                   •  Increase valves exercised by 25%.
                   •  Reduce wet weather peaking factor to a 3 or less.


                                                                                                         254