
Page 251 - Mansfield 2019 Operating Budget
P. 251
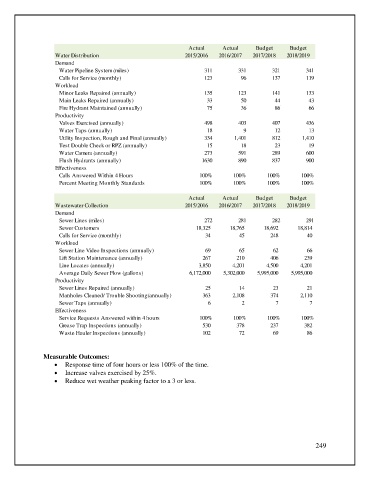
Actual      Actual     Budget     Budget
                   Water Distribution                         2015/2016  2016/2017   2017/2018  2018/2019
                   Demand
                      Water Pipeline System (miles)                  311        331        321        341
                      Calls for Service (monthly)                    123         96        137        119
                   Workload
                      Minor Leaks Repaired (annually)                135        123        141        133
                      Main Leaks Repaired (annually)                  33         50         44         43
                      Fire Hydrant Maintained (annually)              75         36         86         66
                   Productivity
                      Valves Exercised (annually)                    498        403        407        436
                      Water Taps (annually)                           18          9         12         13
                      Utility Inspection, Rough and Final (annually)  334      1,401       812       1,410
                      Test Double Check or RPZ (annually)             15         18         23         19
                      Water Camera (annually)                        273        591        289        600
                      Flush Hydrants (annually)                     1630        890        837        900
                   Effectiveness
                      Calls Answered Within 4 Hours                100%       100%       100%        100%
                      Percent Meeting Monthly Standards            100%       100%       100%        100%

                                                               Actual      Actual     Budget     Budget
                   Wastewater Collection                      2015/2016  2016/2017   2017/2018  2018/2019
                   Demand
                      Sewer Lines (miles)                            272        281        282        291

                      Sewer Customers                                      18,325             18,765             18,692             18,814
                      Calls for Service (monthly)                               34                      45                    248                      40

                   Workload
                      Sewer Line Video Inspections (annually)                    69                      65                      62                      66


                      Lift Station Maintenance (annually)                     267                  210                  406                    239


                      Line Locates (annually)                              3,850               4,201               4,500                 4,201
                      Average Daily Sewer Flow (gallons)              6,172,000          5,302,000        5,995,000        5,995,000
                   Productivity
                      Sewer Lines Repaired (annually)                           25                    14                    23                      21


                      Manholes Cleaned/ Trouble Shooting(annually)                    363                 2,108                    374                 2,110


                      Sewer Taps (annually)                                      6                      2                      7                      7
                   Effectiveness
                      Service Requests Answered within 4 hours     100%       100%       100%        100%

                      Grease Trap Inspections (annually)                       530                  378                    237                    382
                      Waste Hauler Inspections (annually)                    102                      72                    69                    86


               Measurable Outcomes:
                   •  Response time of four hours or less 100% of the time.
                   •  Increase valves exercised by 25%.
                   •  Reduce wet weather peaking factor to a 3 or less.


                                                                                                         249