
Page 254 - Mansfield 2019 Operating Budget
P. 254
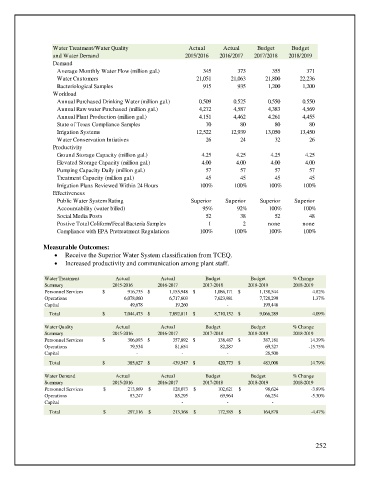
Water Treatment/Water Quality               Actual      Actual     Budget      Budget
                   and Water Demand                           2015/2016   2016/2017  2017/2018   2018/2019
                   Demand
                      Average Monthly Water Flow (million gal.)                   345                  373                  355                  371
                      Water Customers                                    21,051             21,063               21,800               22,236


                      Bacteriological Samples                                 915                  935               1,200               1,200
                   Workload
                      Annual Purchased Drinking Water (million gal.)                0.509               0.525               0.550  0.550
                      Annual Raw water Purchased (million gal.)                4,272               4,587               4,383               4,569
                      Annual Plant Production (million gal.)                4.151               4,462               4.261  4,455
                      State of Texas Compliance Samples                         70                    80                    80                    80
                      Irrigation Systems                                 12,522             12,939             13,050             13,450


                      Water Conservation Intiatives                             26                    24                      32                      26
                   Productivity

                      Ground Storage Capacity (million gal.)                   4.25                 4.25                   4.25                 4.25


                      Elevated Storage Capacity (million gal.)                 4.00                   4.00                   4.00                 4.00

                      Pumping Capacity Daily (million gal.)                       57                    57                    57                      57


                      Treatment Capacity (million gal.)                           45                    45                    45                    45


                      Irrigation Plans Reviewed Within 24 Hours    100%        100%       100%       100%
                   Effectiveness
                      Public Water System Rating                Superior    Superior   Superior   Superior
                      Accountability (water billed)                 95%        92%        100%       100%


                      Social Media Posts                                          52                    38                    52                      48

                      Postive Total Coliform/Fecal Bacteria Samples                      1                        2  none  none
                      Compliance with EPA Pretreatment Regulations  100%       100%       100%       100%

               Measurable Outcomes:
                   •  Receive the Superior Water System classification from TCEQ.
                   •  Increased productivity and communication among plant staff.

                Water Treatment        Actual         Actual         Budget         Budget        % Change
                Summary               2015-2016      2016-2017      2017-2018      2018-2019      2018-2019
                Personnel Services  $                     916,735 $                  1,155,948 $                  1,086,171 $                  1,138,544  4.82%
                Operations                             6,078,060                     6,717,603                     7,623,981                     7,728,299  1.37%
                Capital                                     49,678                          19,260                                -                         199,446
                 Total             $                  7,044,473 $                  7,892,811 $                  8,710,152 $                  9,066,289  4.09%
                Water Quality          Actual         Actual         Budget         Budget        % Change
                Summary               2015-2016      2016-2017      2017-2018      2018-2019      2018-2019
                Personnel Services  $                     306,093 $                     357,892 $                     338,487 $                     387,181  14.39%
                Operations                                  79,534                          81,654                          82,287                          69,327  -15.75%
                Capital                                           -                                 -                                 -                           26,500
                 Total             $                     385,627 $                     439,547 $                     420,773 $                     483,008  14.79%

                Water Demand           Actual         Actual         Budget         Budget        % Change
                Summary               2015-2016      2016-2017      2017-2018      2018-2019      2018-2019

                Personnel Services  $                    213,869  $                      128,073  $                    102,621  $                        98,624  -3.89%

                Operations                                 83,247                            85,295                            69,964                          66,254  -5.30%


                Capital                                                          -                                 -                                 -
                 Total             $                      297,116  $                      213,368  $                      172,585  $                    164,878  -4.47%


                                                                                                         252