
Page 259 - Mansfield 2019 Operating Budget
P. 259
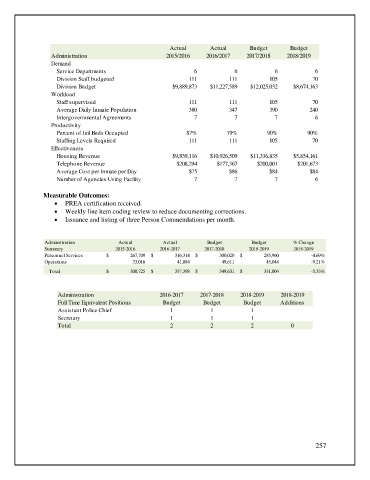
Actual        Actual       Budget       Budget
                  Administration                        2015/2016    2016/2017     2017/2018    2018/2019
                  Demand
                    Service Departments                          6             6            6            6
                    Division Staff budgeted                    111           111          105           70
                    Division Budget                       $9,889,873   $11,227,589  $12,025,032   $8,674,163
                  Workload
                    Staff supervised                           111           111          105           70
                    Average Daily Inmate Population            380           347          390          240
                    Intergovernmental Agreements                 7             7            7            6
                  Productivity
                    Percent of Jail Beds Occupied              87%          79%          90%           90%
                    Staffing Levels Required                   111           111          105           70
                  Effectiveness
                    Housing Revenue                       $9,839,116   $10,926,509  $11,336,835   $5,854,161
                    Telephone Revenue                      $208,294      $177,367     $200,001     $201,673
                    Average Cost per Inmate per Day            $75           $86          $84          $84
                    Number of Agencies Using Facility            7             7            7            6

               Measurable Outcomes:
                   •  PREA certification received.
                   •  Weekly line item coding review to reduce documenting corrections.
                   •  Issuance and listing of three Person Commendations per month.


                Administration          Actual         Actual         Budget        Budget        % Change
                Summary                2015-2016      2016-2017      2017-2018     2018-2019      2018-2019

                Personnel Services  $                      267,709  $                      316,314  $                    300,020  $                    285,960  -4.69%

                Operations                                    33,016                            41,084                            49,611                            45,044  -9.21%


                 Total              $                    300,725  $                    357,398  $                      349,631  $                      331,004  -5.33%


                    Administration                    2016-2017    2017-2018     2018-2019    2018-2019
                    Full Time Equivalent Positions     Budget       Budget        Budget      Additions
                    Assistant Police Chief               1             1            1
                    Secretary                            1             1            1
                    Total                                2             2            2            0


                                                                                                         257