
Page 261 - Mansfield 2019 Operating Budget
P. 261
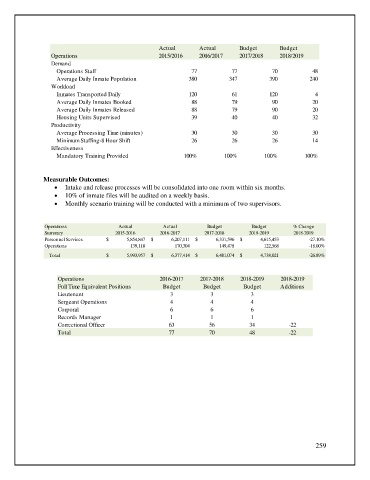
Actual       Actual       Budget        Budget
                  Operations                          2015/2016    2016/2017    2017/2018     2018/2019
                  Demand
                    Operations Staff                            77            77           70           48
                    Average Daily Inmate Population            380           347          390          240
                  Workload
                    Inmates Transported Daily                  120            61          120            4
                    Average Daily Inmates Booked                88            79           90           20
                    Average Daily Inmates Released              88            79           90           20
                    Housing Units Supervised                    39            40           40           32
                  Productivity
                    Average Processing Time (minutes)           30            30           30           30
                    Minimum Staffing-8 Hour Shift               26            26           26           14
                  Effectiveness
                    Mandatory Training Provided               100%         100%         100%          100%


               Measurable Outcomes:
                   •  Intake and release processes will be consolidated into one room within six months.
                   •  10% of inmate files will be audited on a weekly basis.
                   •  Monthly scenario training will be conducted with a minimum of two supervisors.


                Operations              Actual         Actual         Budget        Budget        % Change
                Summary                2015-2016      2016-2017      2017-2018     2018-2019      2018-2019
                Personnel Services  $                   5,854,847  $                   6,207,111  $                   6,331,596  $                   4,615,453  -27.10%


                Operations                                139,110                        170,304                          149,478                        122,568  -18.00%

                 Total              $                   5,993,957  $                 6,377,414  $                 6,481,074  $                   4,738,021  -26.89%


                    Operations                        2016-2017    2017-2018     2018-2019    2018-2019
                    Full Time Equivalent Positions     Budget       Budget        Budget      Additions
                    Lieutenant                           3             3            3
                    Sergeant Operations                  4             4            4
                    Corporal                             6             6            6
                    Records Manager                      1             1            1
                    Correctional Officer                 63           56            34           -22
                    Total                                77           70            48           -22


                                                                                                         259