
Page 248 - Mansfield 2019 Operating Budget
P. 248
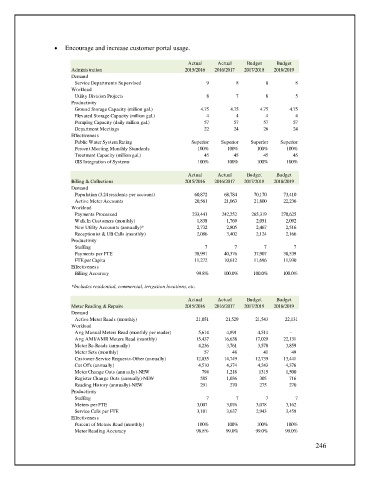
•  Encourage and increase customer portal usage.

                                                               Actual    Actual    Budget    Budget
                         Administration                       2015/2016  2016/2017  2017/2018  2018/2019
                         Demand
                            Service Departments Supervised           9         8         8         8
                         Workload
                            Utility Division Projects                8         7         8         5
                         Productivity
                            Ground Storage Capacity (million gal.)  4.75     4.75      4.75      4.75
                            Elevated Storage Capacity (million gal.)  4        4         4         4
                            Pumping Capacity (daily million gal.)    57       57        57        57
                            Department Meetings                      22       24        26        24
                         Effectiveness
                            Public Water System Rating          Superior  Superior  Superior  Superior
                            Percent Meeting Monthly Standards     100%      100%      100%      100%
                            Treatment Capacity (million gal.)        45       45        45        45
                            GIS Integration of Systems            100%      100%      100%      100%
                                                               Actual    Actual    Budget    Budget
                         Billing & Collections                2015/2016  2016/2017  2017/2018  2018/2019
                         Demand
                            Population (3.24 residents per account)              60,872             68,784             70,170             73,410
                            Active Meter Accounts                        20,561             21,063             21,800             22,236
                         Workload
                            Payments Processed                   233,441  242,252   265,319   270,625
                            Walk In Customers (monthly)           1,838     1,769     2,051     2,092
                            New Utility Accounts (annually)*                2,732               2,805               2,467               2,516
                            Receptionist & UB Calls (monthly)     2,086     3,402     2,124     2,166
                         Productivity
                            Staffing                                              7                          7                        7                      7
                            Payments per FTE                     38,991    40,376    37,907    38,539
                            FTE per Capita                       11,272    10,612    11,696    11,930
                         Effectiveness
                            Billing Accuracy                      99.8%    100.0%    100.0%    100.0%
                         *Includes residential, commercial, irrigation locations, etc.

                                                               Actual    Actual    Budget    Budget
                         Meter Reading & Repairs              2015/2016  2016/2017  2017/2018  2018/2019
                         Demand
                            Active Meter Reads (monthly)          21,051    21,529   21,543    22,131
                         Workload
                            Avg Manual Meters Read (monthly per reader)  5,614               4,891  4,514                   -
                            Avg AMI/AMR Meters Read (monthly)     15,437             16,638  17,029             22,131
                            Meter Re-Reads (annually)              4,236               3,761  3,578               3,859
                            Meter Sets (monthly)                     57                    48  41                    49
                            Customer Service Requests-Other (annually)  12,835             14,749  12,739             13,441
                            Cut Offs (annually)                    4,510               4,374  4,243               4,376
                            Meter Change Outs (annually)-NEW        794               1,218  1315               1,500
                            Register Change Outs (annually)-NEW    585               1,036  305                    716

                            Reading History (annually)-NEW         291                  270  275                  270
                         Productivity
                            Staffing                                 7         7         7         7
                            Meters per FTE                        3,007     3,076     3,078     3,162
                            Service Calls per FTE                 3,181     3,637     2,943     3,459
                         Effectiveness
                            Percent of Meters Read (monthly)      100%      100%      100%      100%
                            Meter Reading Accuracy                98.8%     99.0%     99.0%    99.0%

                                                                                                         246