
Page 231 - Mansfield 2019 Operating Budget
P. 231
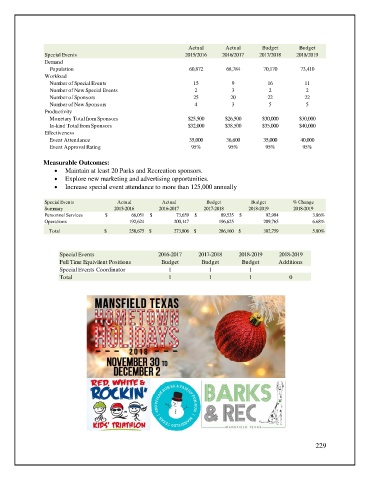
Actual       Actual      Budget      Budget
                Special Events                                2015/2016    2016/2017   2017/2018   2018/2019
                Demand
                 Population                                     60,872      68,784      70,170      73,410
                Workload
                 Number of Special Events                        15           9           16          11
                 Number of New Special Events                    2            3           2           2
                 Number of Sponsors                              25          20           22          22
                 Number of New Sponsors                          4            3           5           5
                Productivity
                 Monetary Total from Sponsors                  $25,500     $26,500      $30,000     $30,000
                 In-kind Total from Sponsors                   $32,000     $38,500      $35,000     $40,000
                Effectiveness
                 Event Attendance                               35,000      36,600      35,000      40,000
                 Event Approval Rating                          95%          95%         95%         95%

               Measurable Outcomes:
                   •  Maintain at least 20 Parks and Recreation sponsors.
                   •  Explore new marketing and advertising opportunities.
                   •  Increase special event attendance to more than 125,000 annually

                Special Events          Actual         Actual        Budget         Budget        % Change
                Summary                2015-2016      2016-2017     2017-2018      2018-2019      2018-2019

                Personnel Services  $                        66,051  $                        73,659  $                        89,535  $                      92,994  3.86%

                Operations                                  192,624                        200,147                          196,625                          209,765  6.68%
                 Total              $                     258,675 $                     273,806 $                     286,160 $                     302,759  5.80%


                     Special Events                  2016-2017     2017-2018    2018-2019    2018-2019
                     Full Time Equivilent Positions   Budget        Budget       Budget      Additions
                     Special Events Coordinator          1            1            1
                     Total                               1            1            1             0


                                                                                                         229