
Page 228 - Mansfield 2019 Operating Budget
P. 228
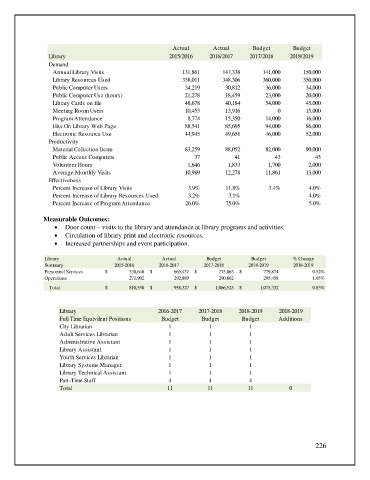
Actual       Actual        Budget       Budget
                 Library                                 2015/2016    2016/2017     2017/2018    2018/2019
                 Demand
                  Annual Library Visits                      131,861       147,338      141,000      150,000
                  Library Resources Used                     338,011       348,306      360,000      350,000
                  Public Computer Users                       34,219        30,812       36,000       34,000
                  Public Computer Use (hours)                 21,278        18,459       23,000       20,000
                  Library Cards on file                       48,678        40,184       54,000       45,000
                  Meeting Room Users                          10,453        13,916           0        15,000
                  Program Attendance                           8,774        15,350       14,000       16,000
                  Hits On Library Web Page                    88,541        85,695       94,000       86,000
                  Electronic Resource Use                     44,945        49,651       46,000       52,000
                 Productivity
                  Material Collection Items                   83,259        88,052       82,000       90,000
                  Public Access Computers                        37            41           43           45
                  Volunteer Hours                              1,646        1,833         1,700        2,000
                  Average Monthly Visits                      10,989        12,278       11,861       13,000
                 Effectiveness
                  Percent Increase of Library Visits           3.9%         11.8%         3.4%         4.0%
                  Percent Increase of Library Resources Used   3.2%          3.1%                      4.0%
                  Percent Increase of Program Attendance      26.0%         75.0%                      5.0%

               Measurable Outcomes:
                   •  Door count – visits to the library and attendance at library programs and activities.
                   •  Circulation of library print and electronic resources.
                   •  Increased partnerships and event participation.

                Library                 Actual         Actual        Budget         Budget        % Change
                Summary                2015-2016      2016-2017     2017-2018      2018-2019      2018-2019
                Personnel Services  $                     538,648  $                     665,437  $                      775,863  $                      779,874  0.52%


                Operations                                271,902                        292,889                        290,662                          295,458  1.65%

                 Total              $                    810,550  $                    958,327  $                   1,066,525  $                   1,075,332  0.83%


                     Library                         2016-2017     2017-2018    2018-2019    2018-2019
                     Full Time Equivilent Positions   Budget        Budget       Budget      Additions
                     City Librarian                      1            1            1
                     Adult Services Librarian            1            1            1
                     Administrative Assistant            1            1            1
                     Library Assistant                   1            1            1
                     Youth Services Librarian            1            1            1
                     Library Systems Manager             1            1            1
                     Library Technical Assistant         1            1            1
                     Part-Time Staff                     4            4            4
                     Total                              11            11           11            0


                                                                                                         226