
Page 158 - Mansfield 2019 Operating Budget
P. 158
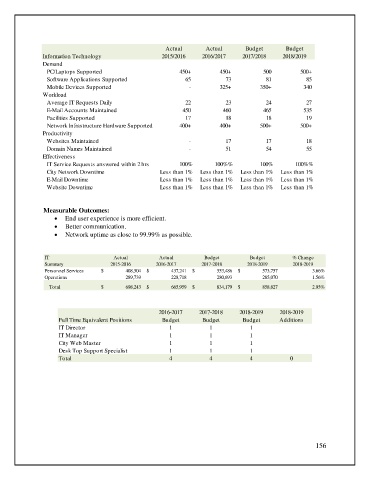
Actual       Actual       Budget        Budget
               Information Technology                  2015/2016    2016/2017    2017/2018     2018/2019
               Demand

                 PC/Laptops Supported                       450+          450+                      500  500+

                 Software Applications Supported                             65                          73                          81                        85
                 Mobile Devices Supported                       -         325+         350+                        340
               Workload

                 Average IT Requests Daily                                   22                          23                          24                        27


                 E-Mail Accounts Maintained                              450                        460                      465                      535

                 Facilities Supported                                      17                          18                        18                        19


                 Network Infrastructure Hardware Supported  400+          400+         500+         500+
               Productivity

                 Websites Maintained                            -                        17                          17                        18

                 Domain Names Maintained                        -                          51                          54                          55
               Effectiveness
                 IT Service Requests answered within 2 hrs  100%        100%%          100%        100%%
                 City Network Downtime                Less than 1%  Less than 1%  Less than 1%  Less than 1%
                 E-Mail Downtime                      Less than 1%  Less than 1%  Less than 1%  Less than 1%
                 Website Downtime                     Less than 1%  Less than 1%  Less than 1%  Less than 1%


               Measurable Outcomes:
                   •  End user experience is more efficient.
                   •  Better communication.
                   •  Network uptime as close to 99.99% as possible.


                IT                     Actual         Actual         Budget         Budget        % Change
                Summary               2015-2016      2016-2017      2017-2018      2018-2019      2018-2019
                Personnel Services  $                     408,504  $                     437,241  $                    553,486  $                     573,757  3.66%

                Operations                              289,739                        228,718                         280,693                          285,070  1.56%


                 Total            $                     698,243  $                      665,959  $                      834,179  $                    858,827  2.95%

                                                      2016-2017    2017-2018    2018-2019     2018-2019
                    Full Time Equivalent Positions     Budget       Budget       Budget      Additions
                    IT Director                          1            1             1
                    IT Manager                           1            1             1
                    City Web Master                      1            1             1
                    Desk Top Support Specialist          1            1             1
                    Total                                4            4             4            0


                                                                                                         156