
Page 149 - Mansfield 2019 Operating Budget
P. 149
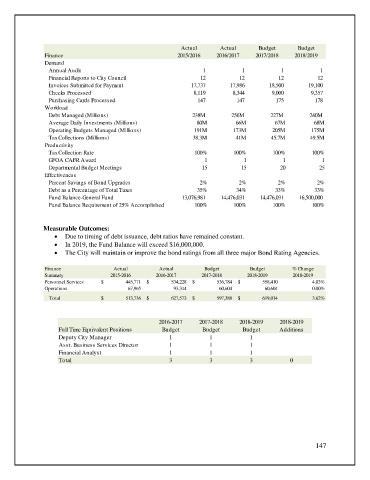
Actual       Actual       Budget       Budget
                Finance                                     2015/2016    2016/2017    2017/2018    2018/2019
                Demand
                 Annual Audit                                                     1                              1                            1                            1
                 Financial Reports to City Council                              12                          12                          12                        12


                 Invoices Submitted for Payment                            17,737                 17,986                 18,500                   19,100
                 Checks Processed                                            8,119                     8,344                     9,000                     9,357
                 Purchasing Cards Processed                                     147                        147                        175                      178

                Workload
                 Debt Managed (Millions)                         238M         256M         227M        240M
                 Average Daily Investments (Millions)             80M          66M          67M          68M
                 Operating Budgets Managed (Millions)            191M         173M         205M         175M
                 Tax Collections (Millions)                      38.3M         41M         45.7M        49.5M
                Productivity
                 Tax Collection Rate                             100%         100%         100%         100%
                 GFOA CAFR Award                                     1            1            1            1
                 Departmental Budget Meetings                       15           15           20           25
                Effectiveness
                 Percent Savings of Bond Upgrades                  2%           2%           2%           2%
                 Debt as a Percentage of Total Taxes              35%          34%          33%          33%
                 Fund Balance-General Fund                        13,076,981            14,476,031            14,476,031            16,500,000

                 Fund Balance Requirement of 25% Accomplished    100%         100%         100%         100%


               Measurable Outcomes:
                   •  Due to timing of debt issuance, debt ratios have remained constant.
                   •  In 2019, the Fund Balance will exceed $16,000,000.
                   •  The City will maintain or improve the bond ratings from all three major Bond Rating Agencies.

                Finance                Actual         Actual         Budget         Budget        % Change
                Summary               2015-2016      2016-2017      2017-2018      2018-2019      2018-2019
                Personnel Services  $                     445,771  $                      534,228  $                      536,784  $                    558,410  4.03%


                Operations                                 67,965                           93,344                          60,604                            60,604  0.00%
                 Total            $                     513,736  $                     627,573  $                     597,388  $                      619,014  3.62%


                                                      2016-2017    2017-2018    2018-2019     2018-2019
                    Full Time Equivalent Positions     Budget       Budget       Budget      Additions
                    Deputy City Manager                  1            1             1
                    Asst. Business Services Director     1            1             1
                    Financial Analyst                    1            1             1
                    Total                                3            3             3            0


                                                                                                         147