
Page 168 - FY 19 Budget Forecast 91218.xlsx
P. 168
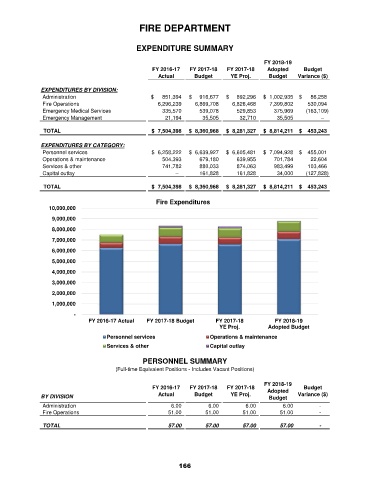
FIRE DEPARTMENT


                                              EXPENDITURE SUMMARY

                                                                                        FY 2018-19
                                                   FY 2016-17   FY 2017-18   FY 2017-18   Adopted    Budget
                                                     Actual      Budget      YE Proj.     Budget    Variance ($)

               EXPENDITURES BY DIVISION:
               Administration                      $        851,394  $       916,677  $       892,296  $    1,002,935  $        86,258
               Fire Operations                            6,296,239        6,869,708        6,826,468        7,399,802          530,094
               Emergency Medical Services                    335,570           539,078           529,853           375,969         (163,109)
               Emergency Management                            21,194             35,505             32,710             35,505                   –
               TOTAL                               $   7,504,398  $   8,360,968  $   8,281,327  $    8,814,211  $     453,243

               EXPENDITURES BY CATEGORY:
               Personnel services                  $    6,258,222  $    6,639,927  $    6,605,481  $    7,094,928  $      455,001
               Operations & maintenance                      504,393           679,180           639,955           701,784            22,604
               Services & other                              741,782           880,033           874,063           983,499          103,466
               Capital outlay                                         –           161,828           161,828             34,000         (127,828)

               TOTAL                               $   7,504,398  $   8,360,968  $   8,281,327  $    8,814,211  $     453,243

                                                     Fire Expenditures
                  10,000,000
                   9,000,000

                   8,000,000
                   7,000,000
                   6,000,000
                   5,000,000

                   4,000,000
                   3,000,000
                   2,000,000
                   1,000,000
                          -
                              FY 2016-17 Actual   FY 2017-18 Budget     FY 2017-18          FY 2018-19
                                                                          YE Proj.        Adopted Budget
                                    Personnel services                Operations & maintenance
                                    Services & other                  Capital outlay

                                                PERSONNEL SUMMARY
                                       (Full-time Equivalent Positions - Includes Vacant Positions)

                                                                                        FY 2018-19
                                                   FY 2016-17   FY 2017-18   FY 2017-18   Adopted    Budget
               BY DIVISION                           Actual      Budget      YE Proj.     Budget    Variance ($)
               Administration                                      6.00                 6.00                 6.00                 6.00                  -
               Fire Operations                                   51.00               51.00               51.00               51.00                  -

               TOTAL                                            57.00               57.00               57.00               57.00                 -


                                                            166