
Page 173 - FY 19 Budget Forecast 91218.xlsx
P. 173
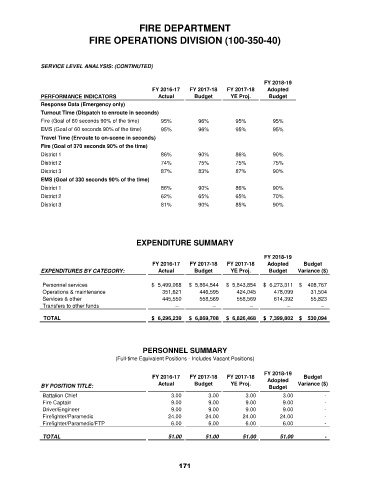
FIRE DEPARTMENT
                               FIRE OPERATIONS DIVISION (100-350-40)


               SERVICE LEVEL ANALYSIS: (CONTINUTED)

                                                                                        FY 2018-19
                                                   FY 2016-17   FY 2017-18   FY 2017-18   Adopted
               PERFORMANCE INDICATORS                Actual      Budget      YE Proj.     Budget
               Response Data (Emergency only)
               Turnout Time (Dispatch to enroute in seconds)
               Fire (Goal of 80 seconds 90% of the time)  95%      96%         95%         95%
               EMS (Goal of 60 seconds 90% of the time)  95%       96%         95%         95%
               Travel Time (Enroute to on-scene in seconds)
               Fire (Goal of 370 seconds 90% of the time)
               District 1                             86%          90%         86%         90%
               District 2                             74%          75%         75%         75%
               District 3                             87%          83%         87%         90%
               EMS (Goal of 330 seconds 90% of the time)
               District 1                             86%          90%         86%         90%
               District 2                             62%          65%         65%         70%
               District 3                             81%          90%         85%         90%


                                              EXPENDITURE SUMMARY

                                                                                        FY 2018-19
                                                   FY 2016-17   FY 2017-18   FY 2017-18   Adopted    Budget
               EXPENDITURES BY CATEGORY:             Actual      Budget      YE Proj.     Budget    Variance ($)

               Personnel services                  $    5,499,068  $    5,864,544  $    5,843,854  $    6,273,311  $      408,767
               Operations & maintenance                      351,621           446,595           424,045           478,099            31,504
               Services & other                              445,550           558,569           558,569           614,392            55,823
               Transfers to other funds                               –                     –                     –                     –                   –

               TOTAL                               $   6,296,239  $   6,869,708  $   6,826,468  $    7,399,802  $     530,094


                                                PERSONNEL SUMMARY
                                       (Full-time Equivalent Positions - Includes Vacant Positions)

                                                                                        FY 2018-19
                                                   FY 2016-17   FY 2017-18   FY 2017-18   Adopted    Budget
               BY POSITION TITLE:                    Actual      Budget      YE Proj.     Budget    Variance ($)
               Battalion Chief                                     3.00                 3.00                 3.00                 3.00                    -
               Fire Captain                                        9.00                 9.00                 9.00                 9.00                    -
               Driver/Engineer                                     9.00                 9.00                 9.00                 9.00                    -
               Firefighter/Paramedic                             24.00               24.00               24.00               24.00                    -
               Firefighter/Paramedic/FTP                           6.00                 6.00                 6.00                 6.00                    -
               TOTAL                                            51.00               51.00               51.00               51.00                    -


                                                            171