Page 64 - Haltom City FY19 Annual Budget
P. 64

HUMAN RESOURCES AND RISK MANAGEMENT


                                                                    Actual     Adopted     Projected   Adopted
           EXPENDITURES                                            FY2017      FY2018      FY 2018      FY 2019
           Personnel                                                $377,917    $415,356    $415,356    $429,096
           Operations                                                129,731     180,707     180,707     180,707
           Total                                                    $507,648    $596,063    $596,063    $609,803


                                                                    Actual     Adopted     Projected   Adopted
           STAFFING                                 Class Range    FY2017      FY2018      FY 2018      FY 2019
           Director of Human Resources & Risk Mgmt   1401   85        1           1           1            1
           Human Resources Specialist                1404   60        1           1           1            1
           Human Resources Generalist                1402   59        1           1           1            1
           Human Resources Coordinator               1403   55        1           1           1            1
           Total                                                      4           4           4            4


                                                                  Actual      Actual      Estimate      Target
            PERFORMANCE MEASURES                                 FY2016       FY2017       FY2018       FY2019
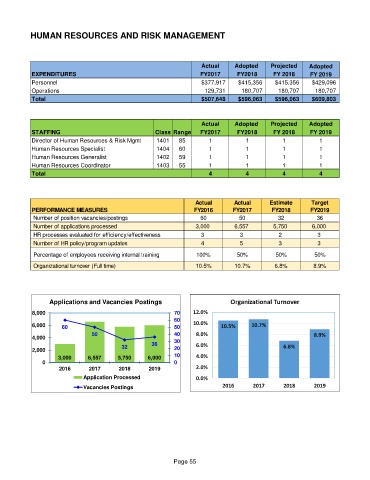
             Number of position vacancies/postings                 60           50           32           36
             Number of applications processed                     3,000        6,557       5,750        6,000
             HR processes evaluated for efficiency/effectiveness    3           3            2            3
             Number of HR policy/program updates                    4           5            3            3

             Percentage of employees receiving internal training  100%         50%          50%          50%
             Organizational turnover (Full time)                  10.5%        10.7%        6.8%         8.9%


                 Applications and Vacancies Postings                         Organizational Turnover

            8,000                                          70    12.0%
                                                           60
            6,000     60                                   50    10.0%    10.5%     10.7%
                               50                          40     8.0%
            4,000                                          30                                            8.9%
                                         32        36             6.0%                         6.8%
            2,000                                          20
                    3,000     6,557     5,750     6,000    10     4.0%
               0                                           0
                     2016     2017      2018      2019            2.0%
                             Application Processed                0.0%
                             Vacancies Postings                            2016      2017      2018      2019


                                                          Page 55
   59   60   61   62   63   64   65   66   67   68   69