
Page 44 - Haltom City FY19 Annual Budget
P. 44
MAJOR REVENUES
PROPERTY TAX
The City’s property tax is levied based on appraised value of property as determined by
the Tarrant County Appraisal District. The Tarrant County Tax Office bills and collects
the property tax for the City.
The combined tax rate is $0.653 per $100 assessed valuation, which consists of $0.423
for maintenance and operations cost (recorded in the General Fund) and $0.230 for
principal and interest payments on bond indebtedness (recorded in the Debt Service
Fund).
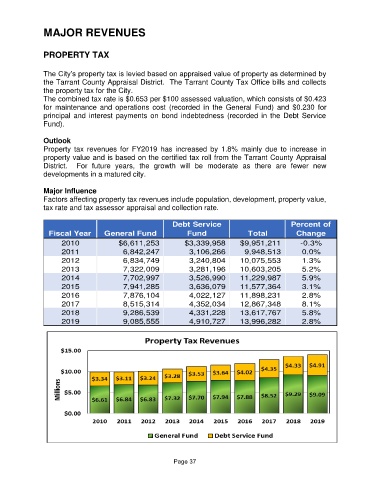
Outlook
Property tax revenues for FY2019 has increased by 1.8% mainly due to increase in
property value and is based on the certified tax roll from the Tarrant County Appraisal
District. For future years, the growth will be moderate as there are fewer new
developments in a matured city.
Major Influence
Factors affecting property tax revenues include population, development, property value,
tax rate and tax assessor appraisal and collection rate.
Debt Service Percent of
Fiscal Year General Fund Fund Total Change
2010 $6,611,253 $3,339,958 $9,951,211 -0.3%
2011 6,842,247 3,106,266 9,948,513 0.0%
2012 6,834,749 3,240,804 10,075,553 1.3%
2013 7,322,009 3,281,196 10,603,205 5.2%
2014 7,702,997 3,526,990 11,229,987 5.9%
2015 7,941,285 3,636,079 11,577,364 3.1%
2016 7,876,104 4,022,127 11,898,231 2.8%
2017 8,515,314 4,352,034 12,867,348 8.1%
2018 9,286,539 4,331,228 13,617,767 5.8%
2019 9,085,555 4,910,727 13,996,282 2.8%
Page 37