
Page 47 - Haltom City FY19 Annual Budget
P. 47
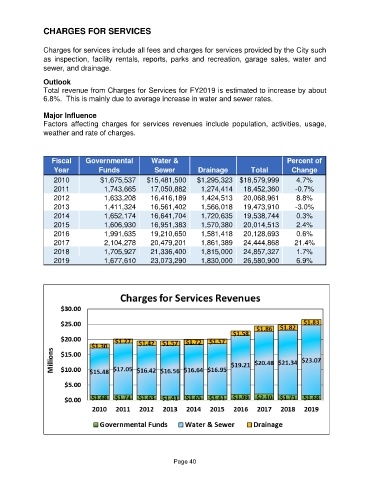
CHARGES FOR SERVICES

               Charges for services include all fees and charges for services provided by the City such
               as  inspection,  facility  rentals,  reports,  parks  and  recreation,  garage  sales,  water  and
               sewer, and drainage.

               Outlook
               Total revenue from Charges for Services for FY2019 is estimated to increase by about
               6.8%.  This is mainly due to average increase in water and sewer rates.

               Major Influence
               Factors  affecting  charges  for  services  revenues  include  population,  activities,  usage,
               weather and rate of charges.


                  Fiscal     Governmental          Water &                                      Percent of
                   Year           Funds             Sewer          Drainage         Total         Change
                   2010           $1,675,537      $15,481,500     $1,295,323 $18,579,999           4.7%
                   2011                 1,743,665       17,050,882       1,274,414     18,452,360  -0.7%
                   2012                 1,633,208       16,416,189       1,424,513     20,068,961  8.8%
                   2013                 1,411,324       16,561,402       1,566,018     19,473,910  -3.0%
                   2014                 1,652,174       16,641,704       1,720,635     19,538,744  0.3%
                   2015                 1,606,930       16,951,383       1,570,380     20,014,513  2.4%
                   2016                 1,991,635       19,210,650       1,581,418     20,128,693  0.6%
                   2017                 2,104,278       20,479,201       1,861,389     24,444,868  21.4%
                   2018                 1,705,927       21,336,400       1,815,000     24,857,327  1.7%
                   2019                 1,677,610       23,073,290       1,830,000     26,580,900  6.9%


                                                          Page 40