
Page 41 - Haltom City FY19 Annual Budget
P. 41
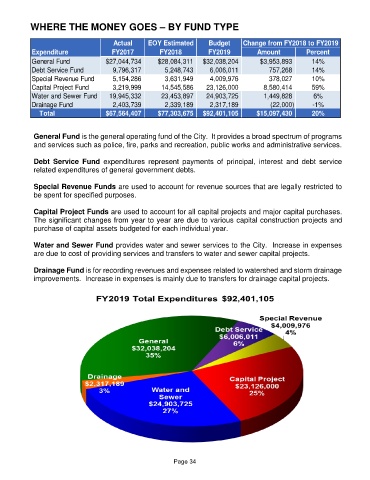
WHERE THE MONEY GOES – BY FUND TYPE


                                       Actual     EOY Estimated       Budget     Change from FY2018 to FY2019
            Expenditure               FY2017          FY2018          FY2019          Amount          Percent
            General Fund            $27,044,734      $28,084,311    $32,038,204        $3,953,893       14%
            Debt Service Fund         9,796,317         5,248,743        6,006,011               757,268  14%
            Special Revenue Fund      5,154,286         3,631,949        4,009,976               378,027  10%
            Capital Project Fund      3,219,999       14,545,586      23,126,000            8,580,414   59%
            Water and Sewer Fund     19,945,332       23,453,897      24,903,725            1,449,828    6%
            Drainage Fund             2,403,739         2,339,189        2,317,189                (22,000)  -1%
                Total               $67,564,407      $77,303,675    $92,401,105       $15,097,430       20%


            General Fund is the general operating fund of the City.  It provides a broad spectrum of programs
            and services such as police, fire, parks and recreation, public works and administrative services.

            Debt  Service  Fund  expenditures  represent  payments  of  principal,  interest  and  debt  service
            related expenditures of general government debts.

            Special Revenue Funds are used to account for revenue sources that are legally restricted to
            be spent for specified purposes.

            Capital Project Funds are used to account for all capital projects and major capital purchases.
            The significant changes from year to year are due to various capital construction projects and
            purchase of capital assets budgeted for each individual year.

            Water and Sewer Fund provides water and sewer services to the City.  Increase in expenses
            are due to cost of providing services and transfers to water and sewer capital projects.

            Drainage Fund is for recording revenues and expenses related to watershed and storm drainage
            improvements.  Increase in expenses is mainly due to transfers for drainage capital projects.


                                                          Page 34