
Page 38 - Haltom City FY19 Annual Budget
P. 38
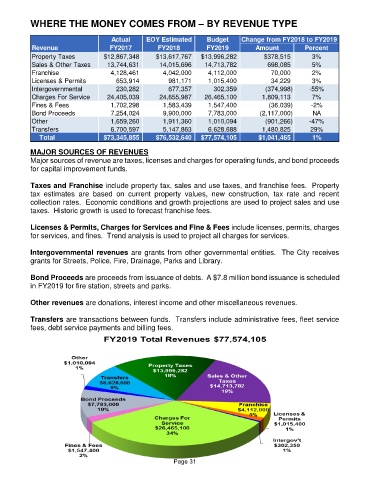
WHERE THE MONEY COMES FROM – BY REVENUE TYPE

                                      Actual     EOY Estimated       Budget      Change from FY2018 to FY2019
            Revenue                  FY2017          FY2018          FY2019           Amount          Percent
            Property Taxes         $12,867,348       $13,617,767    $13,996,282         $378,515        3%
            Sales & Other Taxes        13,744,631          14,015,696       14,713,782                698,085  5%
            Franchise                    4,128,461            4,042,000         4,112,000                  70,000  2%
            Licenses & Permits              653,914               981,171         1,015,400                  34,229  3%
            Intergovernmental               230,282               677,357           302,359               (374,998)  -55%
            Charges For Service        24,405,039          24,655,987       26,465,100             1,809,113  7%
            Fines & Fees                 1,702,298            1,583,439         1,547,400                 (36,039)  -2%
            Bond Proceeds                7,254,024            9,900,000         7,783,000            (2,117,000)  NA
            Other                        1,659,260            1,911,360         1,010,094               (901,266)  -47%
            Transfers                    6,700,597            5,147,863         6,628,688             1,480,825  29%
                Total              $73,345,855       $76,532,640    $77,574,105        $1,041,465       1%
           MAJOR SOURCES OF REVENUES
           Major sources of revenue are taxes, licenses and charges for operating funds, and bond proceeds
           for capital improvement funds.

           Taxes and Franchise include property tax, sales and use taxes, and franchise fees.  Property
           tax  estimates  are  based  on  current  property  values,  new  construction,  tax  rate  and  recent
           collection rates.  Economic conditions and growth projections are used to project sales and use
           taxes.  Historic growth is used to forecast franchise fees.

           Licenses & Permits, Charges for Services and Fine & Fees include licenses, permits, charges
           for services, and fines.  Trend analysis is used to project all charges for services.

           Intergovernmental revenues are grants from other governmental entities.  The City receives
           grants for Streets, Police, Fire, Drainage, Parks and Library.

           Bond Proceeds are proceeds from issuance of debts.  A $7.8 million bond issuance is scheduled
           in FY2019 for fire station, streets and parks.

           Other revenues are donations, interest income and other miscellaneous revenues.

           Transfers are transactions between funds.  Transfers include administrative fees, fleet service
           fees, debt service payments and billing fees.


                                                          Page 31