
Page 40 - Haltom City FY19 Annual Budget
P. 40
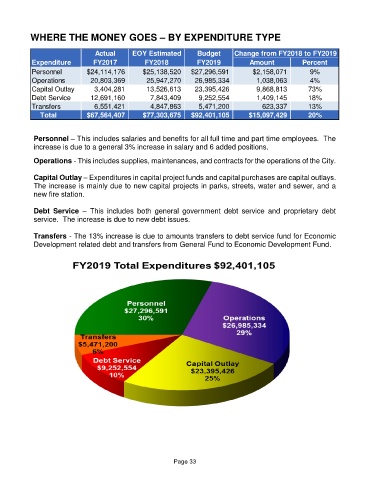
WHERE THE MONEY GOES – BY EXPENDITURE TYPE


                                Actual       EOY Estimated        Budget       Change from FY2018 to FY2019
            Expenditure         FY2017           FY2018           FY2019            Amount           Percent
            Personnel         $24,114,176       $25,138,520     $27,296,591          $2,158,071         9%
            Operations           20,803,369        25,947,270       26,985,334             1,038,063    4%
            Capital Outlay         3,404,281       13,526,613       23,395,426             9,868,813   73%
            Debt Service         12,691,160         7,843,409         9,252,554             1,409,145  18%
            Transfers              6,551,421        4,847,863         5,471,200                623,337  13%
               Total          $67,564,407       $77,303,675     $92,401,105        $15,097,429         20%


            Personnel – This includes salaries and benefits for all full time and part time employees.  The
            increase is due to a general 3% increase in salary and 6 added positions.

            Operations - This includes supplies, maintenances, and contracts for the operations of the City.


            Capital Outlay – Expenditures in capital project funds and capital purchases are capital outlays.
            The increase is mainly due to new capital projects in parks, streets, water and sewer, and a
            new fire station.

            Debt  Service  –  This  includes  both  general  government  debt  service  and  proprietary  debt
            service.  The increase is due to new debt issues.


            Transfers - The 13% increase is due to amounts transfers to debt service fund for Economic
            Development related debt and transfers from General Fund to Economic Development Fund.


                                                          Page 33