
Page 53 - Grapevine FY19 Operating Budget
P. 53
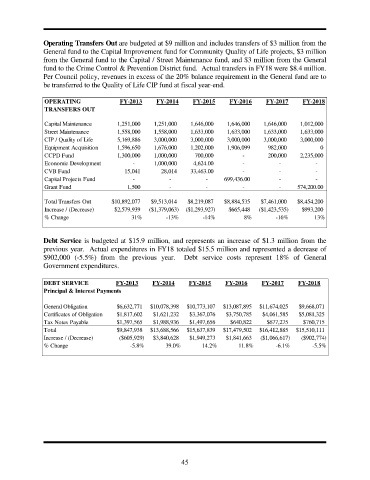
Operating Transfers Out are budgeted at $9 million and includes transfers of $3 million from the
               General fund to the Capital Improvement fund for Community Quality of Life projects, $3 million
               from the General fund to the Capital / Street Maintenance fund, and $3 million from the General
               fund to the Crime Control & Prevention District fund.  Actual transfers in FY18 were $8.4 million.
               Per Council policy, revenues in excess of the 20% balance requirement in the General fund are to
               be transferred to the Quality of Life CIP fund at fiscal year-end.


                OPERATING                FY-2013     FY-2014     FY-2015     FY-2016     FY-2017     FY-2018
                TRANSFERS OUT

                Capital Maintenance     1,251,000   1,251,000   1,646,000   1,646,000   1,646,000   1,012,000
                Street Maintenance      1,558,000   1,558,000   1,633,000   1,633,000   1,633,000   1,633,000
                CIP / Quality of Life   5,169,886   3,000,000   3,000,000   3,000,000   3,000,000   3,000,000
                Equipment Acquisition   1,596,650   1,676,000   1,202,000   1,906,099     982,000          0
                CCPD Fund               1,300,000   1,000,000    700,000                  -  200,000  2,235,000
                Economic Development                  -  1,000,000          4,624.00                  -                  -                  -
                CVB Fund                  15,041      28,014        33,463.00                  -                  -                  -
                Capital Projects Fund                  -                  -                  -       699,436.00                  -                  -
                Grant Fund                 1,500                  -                  -                  -                  -       574,200.00

                Total Transfers Out   $10,892,077  $9,513,014  $8,219,087  $8,884,535  $7,461,000  $8,454,200
                Increase / (Decrease)  $2,579,939  ($1,379,063)  ($1,293,927)  $665,448  ($1,423,535)  $993,200
                % Change                     31%        -13%        -14%          8%        -16%         13%


               Debt Service is budgeted at $15.9 million, and represents  an increase of  $1.3 million from the
               previous year.  Actual expenditures in FY18 totaled $15.5 million and represented a decrease of
               $902,000  (-5.5%) from the previous  year.   Debt service  costs represent 18% of General
               Government expenditures.

                DEBT SERVICE           FY-2013     FY-2014      FY-2015     FY-2016     FY-2017     FY-2018
                Principal & Interest Payments

                General Obligation      $6,632,771  $10,078,398  $10,773,107  $13,087,895  $11,674,025  $9,668,071
                Certificates of Obligation  $1,817,602  $1,621,232  $3,367,076  $3,750,785  $4,061,585  $5,081,325
                Tax Notes Payable       $1,397,565  $1,988,936  $1,497,656   $640,822    $677,275    $760,715
                Total                   $9,847,938  $13,688,566  $15,637,839  $17,479,502  $16,412,885  $15,510,111
                Increase / (Decrease)   ($605,929)  $3,840,628  $1,949,273  $1,841,663  ($1,066,617)  ($902,774)
                % Change                    -5.8%       39.0%       14.2%       11.8%       -6.1%       -5.5%


                                                             45