
Page 48 - Grapevine FY19 Operating Budget
P. 48
General government sales tax receipts for FY 2019 are projected at $28.9 million, an increase of
$1.59 million (5.8%) from the previous year. Annual collections in FY18 increased 4%, but
collections in FY17 fell by 5%, following a trend across the region. Although local development
activities could signal rebound, the City has decided to budget conservatively. Recent reports
indicate that consumer confidence is on the rise, and the local unemployment rate has stabilized.
However, falling oil and natural gas prices could lead to a slowing of the Texas economy in the
coming months.
MIXED BEVERAGE FY-2013 FY-2014 FY-2015 FY-2016 FY-2017 FY-2018
TAX
Collections $1,158,625 $1,566,664 $1,647,776 $1,710,043 $1,733,258 $1,792,674
Gain / (Loss) $107,361 $408,039 $81,112 $62,267 $23,216 $59,416
% Change 10.2% 35.2% 5.2% 3.8% 1.4% 3.4%
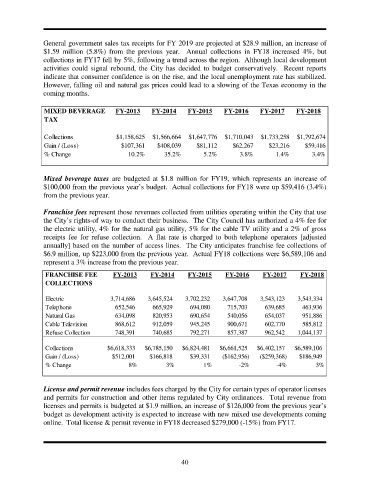
Mixed beverage taxes are budgeted at $1.8 million for FY19, which represents an increase of
$100,000 from the previous year’s budget. Actual collections for FY18 were up $59,416 (3.4%)
from the previous year.
Franchise fees represent those revenues collected from utilities operating within the City that use
the City’s rights-of way to conduct their business. The City Council has authorized a 4% fee for
the electric utility, 4% for the natural gas utility, 5% for the cable TV utility and a 2% of gross
receipts fee for refuse collection. A flat rate is charged to both telephone operators [adjusted
annually] based on the number of access lines. The City anticipates franchise fee collections of
$6.9 million, up $223,000 from the previous year. Actual FY18 collections were $6,589,106 and
represent a 3% increase from the previous year.
FRANCHISE FEE FY-2013 FY-2014 FY-2015 FY-2016 FY-2017 FY-2018
COLLECTIONS
Electric 3,714,686 3,645,524 3,702,232 3,647,708 3,543,123 3,543,334
Telephone 652,546 665,929 694,080 715,703 639,685 463,936
Natural Gas 634,098 820,953 690,654 540,056 654,037 951,886
Cable Television 868,612 912,059 945,245 900,671 602,770 585,812
Refuse Collection 748,391 740,685 792,271 857,387 962,542 1,044,137
Collections $6,618,333 $6,785,150 $6,824,481 $6,661,525 $6,402,157 $6,589,106
Gain / (Loss) $512,001 $166,818 $39,331 ($162,956) ($259,368) $186,949
% Change 8% 3% 1% -2% -4% 3%
License and permit revenue includes fees charged by the City for certain types of operator licenses
and permits for construction and other items regulated by City ordinances. Total revenue from
licenses and permits is budgeted at $1.9 million, an increase of $126,000 from the previous year’s
budget as development activity is expected to increase with new mixed use developments coming
online. Total license & permit revenue in FY18 decreased $279,000 (-15%) from FY17.
40