Page 44 - Grapevine FY19 Operating Budget
P. 44

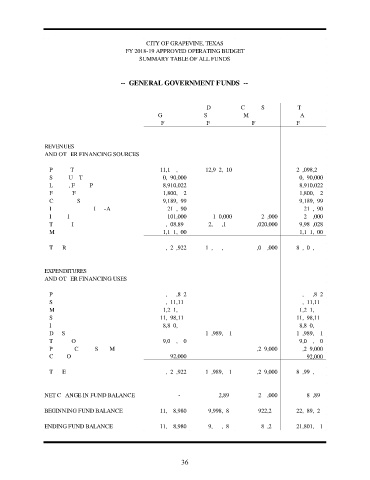
CITY OF GRAPEVINE, TEXAS
                                           FY 2018-19 APPROVED OPERATING BUDGET
                                               SUMMARY TABLE OF ALL FUNDS


                                         --  GENERAL GOVERNMENT FUNDS  --


                                                                     Debt        Capital / Street  Total
                                                     General         Service      Maintenance       All
                                                      Fund           Fund           Fund           Funds


                REVENUES
                AND OTHER FINANCING SOURCES:

                 Property Taxes                       11,165,766     12,932,510                    24,098,276
                 Sales & Use Taxes                    30,690,000                                   30,690,000
                 Licenses, Fees & Permits              8,910,022                                    8,910,022
                 Fines and Forfeitures                 1,800,452                                    1,800,452
                 Charges for Services                  9,189,699                                    9,189,699
                 Intergovernmental / Inter-Agency       217,690                                       217,690
                 Interest Income                        101,000        150,000         24,000         275,000
                 Transfers In                          4,508,893      2,454,135      3,020,000      9,983,028
                 Miscellaneous                         1,141,400                                    1,141,400

                 Total Revenues                       67,724,922     15,536,645      3,044,000     86,305,567


                EXPENDITURES
                AND OTHER FINANCING USES:

                 Personnel                            33,534,842                                   33,534,842
                 Supplies                              3,311,114                                    3,311,114
                 Maintenance                           1,251,755                                    1,251,755
                 Services                             11,598,115                                   11,598,115
                 Insurance                             8,860,466                                    8,860,466
                 Debt Service                                        15,989,541                    15,989,541
                 Transfers Out                         9,076,630                                    9,076,630
                 Permanent Capital / Street Maint.                                   3,279,000      3,279,000
                 Capital Outlay                          92,000                                        92,000

                 Total Expenditures                   67,724,922     15,989,541      3,279,000     86,993,463


                NET CHANGE IN FUND BALANCE                               -                (452,896)               (235,000)               (687,896)

                BEGINNING FUND BALANCE                11,568,980      9,998,383       922,264      22,489,627

                ENDING FUND BALANCE                   11,568,980      9,545,487       687,264      21,801,731


                                                             36
   39   40   41   42   43   44   45   46   47   48   49