
Page 42 - Grapevine FY19 Operating Budget
P. 42
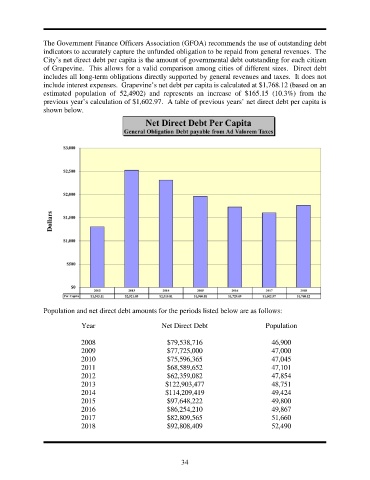
The Government Finance Officers Association (GFOA) recommends the use of outstanding debt
               indicators to accurately capture the unfunded obligation to be repaid from general revenues.  The
               City’s net direct debt per capita is the amount of governmental debt outstanding for each citizen
               of Grapevine.  This allows for a valid comparison among cities of different sizes.  Direct debt
               includes all long-term obligations directly supported by general revenues and taxes.  It does not
               include interest expenses.  Grapevine’s net debt per capita is calculated at $1,768.12 (based on an
               estimated population of  52,4902)  and represents an  increase of $165.15  (10.3%)  from the
               previous year’s calculation of $1,602.97.  A table of previous years’ net direct debt per capita is
               shown below.


               Population and net direct debt amounts for the periods listed below are as follows:

                            Year                       Net Direct Debt                   Population

                            2008                        $79,538,716                        46,900
                            2009                        $77,725,000                        47,000
                            2010                        $75,596,365                        47,045
                            2011                        $68,589,652                        47,101
                            2012                        $62,359,082                        47,854
                            2013                        $122,903,477                       48,751
                            2014                        $114,209,419                       49,424
                            2015                        $97,648,222                        49,800
                            2016                        $86,254,210                        49,867
                            2017                        $82,809,565                        51,660
                            2018                        $92,808,409                        52,490


                                                             34