
Page 49 - Grapevine FY19 Operating Budget
P. 49
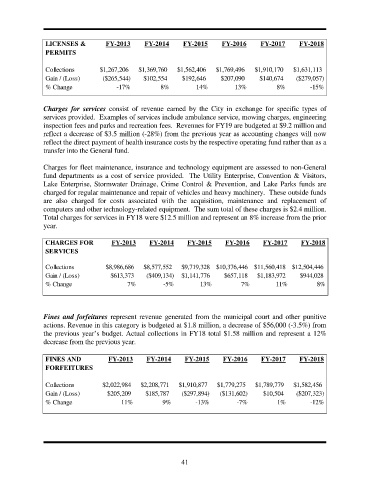
LICENSES &          FY-2013      FY-2014      FY-2015     FY-2016      FY-2017      FY-2018
                PERMITS

                Collections       $1,267,206   $1,369,760   $1,562,406  $1,769,496   $1,910,170   $1,631,113
                Gain / (Loss)      ($265,544)   $102,554     $192,646     $207,090     $140,674    ($279,057)
                % Change                -17%          8%          14%          13%           8%         -15%


               Charges for  services  consist of revenue  earned  by the City in  exchange for specific types of
               services provided.  Examples of services include ambulance service, mowing charges, engineering
               inspection fees and parks and recreation fees.  Revenues for FY19 are budgeted at $9.2 million and
               reflect a decrease of $3.5 million (-28%) from the previous year as accounting changes will now
               reflect the direct payment of health insurance costs by the respective operating fund rather than as a
               transfer into the General fund.

               Charges for fleet maintenance, insurance and technology equipment are assessed to non-General
               fund departments as a cost of service provided.  The Utility Enterprise, Convention & Visitors,
               Lake Enterprise, Stormwater Drainage, Crime Control  & Prevention,  and Lake Parks funds are
               charged for regular maintenance and repair of vehicles and heavy machinery.  These outside funds
               are  also  charged  for costs associated with the  acquisition, maintenance and replacement  of
               computers and other technology-related equipment.  The sum total of these charges is $2.4 million.
               Total charges for services in FY18 were $12.5 million and represent an 8% increase from the prior
               year.

                CHARGES FOR           FY-2013     FY-2014      FY-2015      FY-2016     FY-2017      FY-2018
                SERVICES

                Collections         $8,986,686   $8,577,552  $9,719,328 $10,376,446 $11,560,418 $12,504,446
                Gain / (Loss)         $613,373   ($409,134)  $1,141,776    $657,118   $1,183,972    $944,028
                % Change                   7%          -5%         13%           7%         11%           8%


               Fines and  forfeitures  represent revenue generated from the municipal court and other punitive
               actions. Revenue in this category is budgeted at $1.8 million, a decrease of $56,000 (-3.5%) from
               the previous year’s budget. Actual collections in FY18 total $1.58 million and represent a 12%
               decrease from the previous year.

                FINES AND            FY-2013      FY-2014     FY-2015      FY-2016     FY-2017      FY-2018
                FORFEITURES

                Collections        $2,022,984   $2,208,771  $1,910,877   $1,779,275  $1,789,779   $1,582,456
                Gain / (Loss)        $205,209    $185,787    ($297,894)   ($131,602)    $10,504    ($207,323)
                % Change                 11%           9%         -13%         -7%           1%         -12%


                                                             41