
Page 140 - CityofSouthlakeFY26AdoptedBudget
P. 140
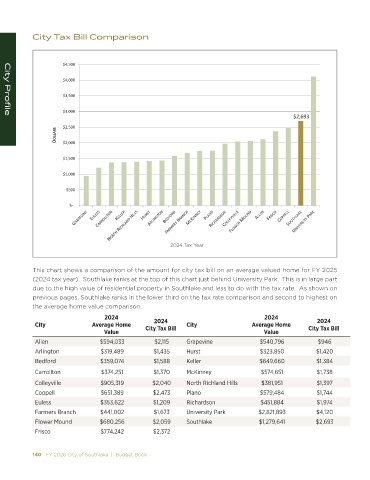
City Tax Bill Comparison


                      Ψϰ͕ϱϬϬ

                      Ψϰ͕ϬϬϬ

                      Ψϯ͕ϱϬϬ

                      Ψϯ͕ϬϬϬ
                                                                                                  ΨϮ͕ϲϵϯ
   City Profile
                      ΨϮ͕ϱϬϬ
                    K>> Z^  ΨϮ͕ϬϬϬ


                      Ψϭ͕ϱϬϬ

                      Ψϭ͕ϬϬϬ

                       ΨϱϬϬ


                        ΨͲ


                                                         2024 Tax Year


            This chart shows a comparison of the amount for city tax bill on an average valued home for FY 2025
            (2024 tax year).  Southlake ranks at the top of this chart just behind University Park.  This is in large part
            due to the high value of residential property in Southlake and less to do with the tax rate.  As shown on
            previous pages, Southlake ranks in the lower third on the tax rate comparison and second to highest on
            the average home value comparison.

                                    2024                                                2024
                                                                                                          2024
                                                    2024
             City              Average Home      City Tax Bill  City                Average Home       City Tax Bill
                                   Value                                                Value
             Allen                 $594,033          $2,115    Grapevine               $540,796            $946
             Arlington             $319,489         $1,435     Hurst                    $323,850          $1,420
             Bedford               $359,074         $1,588     Keller                  $649,660           $1,384
             Carrollton            $374,251         $1,370     McKinney                 $574,651          $1,738
             Colleyville           $905,319         $2,040     North Richland Hills     $381,951          $1,397
             Coppell               $651,389         $2,473     Plano                    $579,484          $1,744
             Euless                $353,622         $1,209     Richardson               $451,884          $1,974
             Farmers Branch        $441,002         $1,673     University Park         $2,821,893         $4,120
             Flower Mound          $680,256         $2,059     Southlake               $1,279,641         $2,693
             Frisco                $774,242         $2,372


            140   FY 2026 City of Southlake  |  Budget Book                                                                                                                                           FY 2026 City of Southlake  |  Budget Book   141