
Page 142 - CityofSouthlakeFY26AdoptedBudget
P. 142
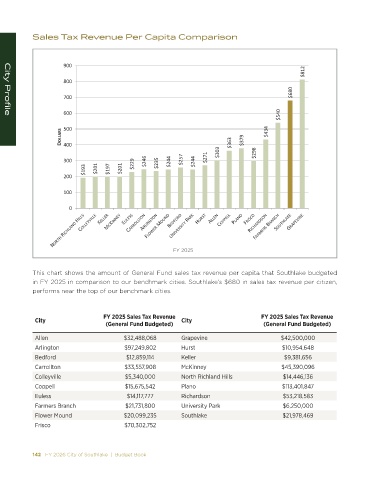
Sales Tax Revenue Per Capita Comparison


                      ϵϬϬ
                                                                                                      ΨϴϭϮ
                      ϴϬϬ
                                                                                                  ΨϲϴϬ
                      ϳϬϬ

                                                                                              ΨϱϰϬ
                      ϲϬϬ
   City Profile
                      ϱϬϬ                                                                 Ψϰϯϰ
                      K>> Z^  ϰϬϬ                                            Ψϯϲϯ  Ψϯϳϵ


                      ϯϬϬ                    ΨϮϮϵ  ΨϮϰϲ  ΨϮϯϱ  ΨϮϰϰ  ΨϮϱϳ  ΨϮϰϰ  ΨϮϳϭ  ΨϯϬϯ  ΨϮϵϴ
                             Ψϭϵϯ  ΨϮϬϭ  Ψϭϵϳ  ΨϮϬϭ
                      ϮϬϬ

                      ϭϬϬ

                        Ϭ


                                                          FY 2025


            This chart shows the amount of General Fund sales tax revenue per capita that Southlake budgeted
            in FY 2025 in comparison to our benchmark cities. Southlake’s $680 in sales tax revenue per citizen,
            performs near the top of our benchmark cities.


                                   FY 2025 Sales Tax Revenue                           FY 2025 Sales Tax Revenue
             City                                            City
                                    (General Fund Budgeted)                             (General Fund Budgeted)

             Allen                         $32,488,068       Grapevine                        $42,500,000
             Arlington                     $97,249,802       Hurst                             $10,954,648
             Bedford                       $12,859,114       Keller                             $9,381,656
             Carrollton                    $33,557,908       McKinney                          $45,390,096
             Colleyville                   $5,340,000        North Richland Hills              $14,446,136
             Coppell                       $15,675,542       Plano                             $113,401,847
             Euless                        $14,117,777       Richardson                        $53,218,583
             Farmers Branch                $21,731,800       University Park                   $6,250,000
             Flower Mound                  $20,099,235       Southlake                         $21,978,469
             Frisco                        $70,302,752


            142   FY 2026 City of Southlake  |  Budget Book                                                                                                                                          FY 2026 City of Southlake  |  Budget Book   143