Page 144 - CityofSouthlakeFY26AdoptedBudget
P. 144

Property Tax Supported Long-Term Debt as a %
            of Assessed Valuation Comparison


                                     Khd^d E /E' WZKW Zdz d y ^hWWKZd      d     d  ^ й K&  ^^ ^^   s >h d/KE
                      ϯ͘ϬϬй                                                               ΨϳϬϬ͕ϬϬϬ͕ϬϬϬ
                                 Southlake Desired
                                 Range per Policy
                                                                                          ΨϲϬϬ͕ϬϬϬ͕ϬϬϬ
                      Ϯ͘ϱϬй

   City Profile
                                                                                          ΨϱϬϬ͕ϬϬϬ͕ϬϬϬ
                      Ϯ͘ϬϬй
                                                                                     ϭ͘ϲϰй  ΨϰϬϬ͕ϬϬϬ͕ϬϬϬ    K>> Z^
                    W Z  Ed '  K& s >h d/KE  ϭ͘ϬϬй  Ϭ͘ϴϬй Ϭ͘ϴϲй Ϭ͘ϴϵй Ϭ͘ϴϵй Ϭ͘ϵϴй ϭ͘ϭϬй ϭ͘ϭϮй ϭ͘ϭϲй ϭ͘ϯϭй ϭ͘ϯϭй  ΨϯϬϬ͕ϬϬϬ͕ϬϬϬ
                                                                                ϭ͘ϰϯй
                      ϭ͘ϱϬй


                                                                                          ΨϮϬϬ͕ϬϬϬ͕ϬϬϬ


                      Ϭ͘ϱϬй
                                               Ϭ͘Ϯϴй                                      ΨϭϬϬ͕ϬϬϬ͕ϬϬϬ
                                        Ϭ͘ϮϮй Ϭ͘Ϯϯй
                                    Ϭ͘ϭϴй
                              Ϭ͘Ϭϲй Ϭ͘ϭϬй
                           Ϭ͘ϬϬй
                      Ϭ͘ϬϬй                                                               ΨͲ


                                                           FY 2025
                             Warning Trend:  Increasing net long-term debt as a percentage of assessed valuation


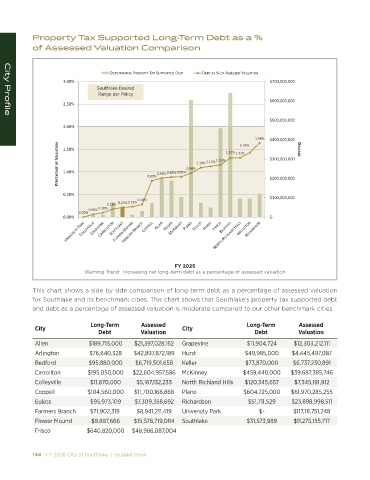
            This chart shows a side by side comparison of long-term debt as a percentage of assessed valuation
            for Southlake and its benchmark cities. This chart shows that Southlake’s property tax supported debt
            and debt as a percentage of assessed valuation is moderate compared to our other benchmark cities.

                               Long-Term        Assessed                           Long-Term        Assessed
             City                                            City
                                  Debt          Valuation                            Debt           Valuation
             Allen             $189,715,000    $21,397,028,162   Grapevine         $11,904,724     $12,303,212,111
             Arlington         $76,640,328    $42,897,872,189  Hurst               $49,985,000    $4,445,497,087
             Bedford           $95,880,000    $6,719,501,658   Keller              $73,870,000    $6,737,230,891
             Carrollton        $195,050,000   $22,604,957,586  McKinney           $459,440,000    $39,687,385,746
             Colleyville       $11,870,000     $5,167,132,233   North Richland Hills   $120,345,657    $7,345,191,912
             Coppell          $104,560,000    $11,700,168,868   Plano             $604,725,000    $61,970,285,255
             Euless            $95,973,109    $7,309,358,692   Richardson           $51,711,529    $23,898,998,511
             Farmers Branch    $71,902,318     $8,941,211,419   University Park        $-          $117,111,751,248
             Flower Mound       $9,897,666    $15,578,719,084   Southlake          $31,573,989     $11,275,155,717
             Frisco           $640,820,000   $48,986,087,004


            144   FY 2026 City of Southlake  |  Budget Book                                                                                                                                          FY 2026 City of Southlake  |  Budget Book   145
   139   140   141   142   143   144   145   146   147   148   149