
Page 143 - CityofSouthlakeFY26AdoptedBudget
P. 143
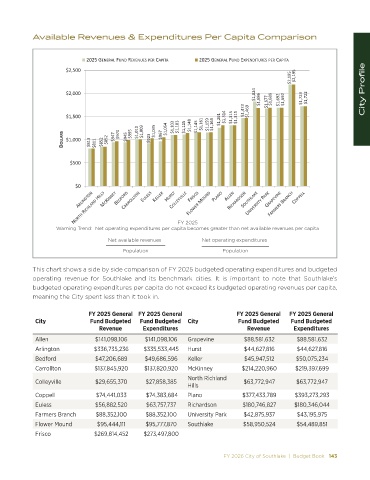
Available Revenues & Expenditures Per Capita Comparison


                              ϮϬϮϱ ' E Z > &hE  Z s Eh ^ W Z   W/d   ϮϬϮϱ ' E Z > &hE   yW E /dhZ ^ W Z   W/d
                       ΨϮ͕ϱϬϬ
                                                                                                 ΨϮ͕ϭϵϱ  ΨϮ͕ϭϵϱ

                                                                                     Ψϭ͕ϴϮϰ  Ψϭ͕ϲϴϲ  Ψϭ͕ϲϳϳ  Ψϭ͕ϲϴϵ  Ψϭ͕ϲϵϮ  Ψϭ͕ϲϵϮ  Ψϭ͕ϳϮϯ  Ψϭ͕ϳϮϮ
                       ΨϮ͕ϬϬϬ                                                                                             City Profile

                                                                                  Ψϭ͕ϰϳϯ  Ψϭ͕ϰϲϵ
                       Ψϭ͕ϱϬϬ                             Ψϭ͕ϭϬϯ  Ψϭ͕ϭϬϯ  Ψϭ͕ϭϭϱ  Ψϭ͕ϭϰϴ  Ψϭ͕ϭϰϱ  Ψϭ͕ϭϲϭ  Ψϭ͕ϭϱϵ  Ψϭ͕ϭϲϯ  Ψϭ͕Ϯϲϭ  Ψϭ͕ϯϭϰ  Ψϭ͕ϯϭϱ  Ψϭ͕ϯϭϱ


                       K>> Z^  Ψϭ͕ϬϬϬ  Ψϴϭϯ  Ψϴϭϭ  ΨϴϱϮ  ΨϴϱϮ  Ψϵϰϳ  ΨϵϳϬ  Ψϵϰϱ  Ψϵϵϱ  Ψϭ͕ϬϭϬ  Ψϭ͕ϬϬϵ  ΨϵϮϯ  Ψϭ͕Ϭϯϱ  Ψϵϲϳ  Ψϭ͕Ϭϱϰ


                        ΨϱϬϬ


                          ΨϬ


                                                            FY 2025
                    Warning Trend:  Net operating expenditures per capita becomes greater than net available revenues per capita

                                     Net available revenues                            Net operating expenditures
                                          Population                       Population


            This chart shows a side by side comparison of FY 2025 budgeted operating expenditures and budgeted
            operating revenue for Southlake and its benchmark cities. It is important to note that Southlake’s
            budgeted operating expenditures per capita do not exceed its budgeted operating revenues per capita,
            meaning the City spent less than it took in.


                              FY 2025 General  FY 2025 General                 FY 2025 General   FY 2025 General
             City              Fund Budgeted   Fund Budgeted  City              Fund Budgeted    Fund Budgeted
                                  Revenue       Expenditures                       Revenue        Expenditures
             Allen               $141,098,106     $141,098,106   Grapevine        $88,581,632       $88,581,632
             Arlington           $336,735,236    $335,533,445   Hurst             $44,627,816       $44,627,816
             Bedford             $47,206,689     $49,686,596   Keller             $45,947,512      $50,075,234
             Carrollton          $137,845,920    $137,820,920   McKinney          $214,220,960     $219,397,699
                                                               North Richland
             Colleyville         $29,655,370      $27,858,385                     $63,772,947       $63,772,947
                                                               Hills
             Coppell             $74,441,033      $74,383,684   Plano             $377,433,789     $393,273,293
             Euless              $56,882,520      $63,757,737   Richardson        $180,746,827     $180,346,044
             Farmers Branch      $88,352,100      $88,352,100   University Park   $42,875,937       $43,195,975
             Flower Mound         $95,444,111     $95,777,870   Southlake         $58,950,524       $54,489,851
             Frisco              $269,814,452    $273,497,800


                                                                           FY 2026 City of Southlake  |  Budget Book   143