
Page 136 - CityofSouthlakeFY26AdoptedBudget
P. 136
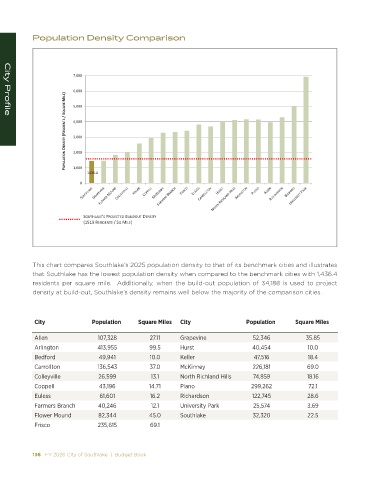
Population Density Comparison


                         ϳ͕ϬϬϬ

                         ϲ͕ϬϬϬ
                       WKWh> d/KE   E^/dz ;Z ^/  Ed^ ͬ ^Yh Z  D/> Ϳ  ϰ͕ϬϬϬ
                         ϱ͕ϬϬϬ

   City Profile


                         ϯ͕ϬϬϬ

                         Ϯ͕ϬϬϬ

                         ϭ͕ϬϬϬ
                              ϭϰϯϲ͘ϰ
                            Ϭ


                             ^Khd,> < Ζ^ WZK:  d    h/> Khd   E^/dz
                             ;ϭϱϭϵ Z ^/  Ed^ ͬ ^Y D/> Ϳ  2024 Residents per Square Mile


            This chart compares Southlake’s 2025 population density to that of its benchmark cities and illustrates
            that Southlake has the lowest population density when compared to the benchmark cities with 1,436.4
            residents per square mile.  Additionally, when the build-out population of 34,188 is used to project
            density at build-out, Southlake’s density remains well below the majority of the comparison cities.


            City               Population      Square Miles  City                 Population       Square Miles

            Allen                 107,328          27.11     Grapevine               52,346            35.85
            Arlington             413,955         99.5       Hurst                   40,454            10.0
            Bedford               49,941           10.0      Keller                  47,516            18.4
            Carrollton            136,543          37.0      McKinney                226,181           69.0
            Colleyville           26,599           13.1      North Richland Hills    74,859            18.16
            Coppell               43,196          14.71      Plano                   299,262            72.1
            Euless                61,601           16.2      Richardson              122,745           28.6
            Farmers Branch        40,246           12.1      University Park         25,574            3.69
            Flower Mound          82,344          45.0       Southlake               32,320            22.5
            Frisco                235,615          69.1


            136   FY 2026 City of Southlake  |  Budget Book                                                                                                                                          FY 2026 City of Southlake  |  Budget Book   137