Page 15 - ClearGov | Documents
P. 15

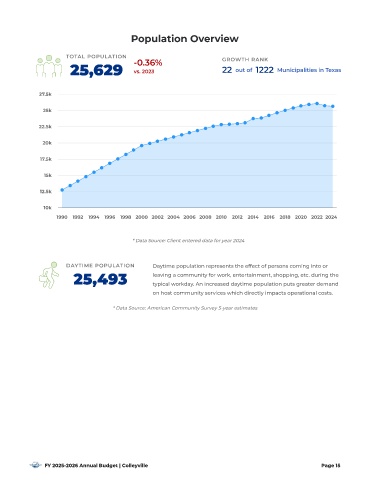
Population Over view


                       T O  T  A  L   P  O  P  U  L  A  T I  O  N
                                                                           G  R  O W  T H     R  A  N K
                                             -0.36%
                        25,629               vs. 2023                      22  out of  1222  Municipalities in Texas


              27.5k

               25k

              22 .5k


               20k

              17.5k

                15k


              12 .5k

               10k
                    1990  1992  1994  1996  1998  2000  2002  2004  2006  2008  2010  2012  2014  2016  2018  2020  2022  2024


                                             * Data Source: Client entered data for year 2024


                       D A Y  T  I  M  E   P  O  P  U  L  A  T I  O  N  Daytime population represents the effect of persons coming into or
                                                    leaving a community for work , enter tainment , shopping, etc . during the
                         25,493
                                                    typical workday. An increased daytime population puts greater demand
                                                    on host community ser vices which directly impacts operational costs.

                                      * Data Source: American Community Sur vey 5-year estimates


                FY 2025-2026 Annual Budget | Colleyville                                                   Page 15
   10   11   12   13   14   15   16   17   18   19   20