
Page 19 - ClearGov | Documents
P. 19
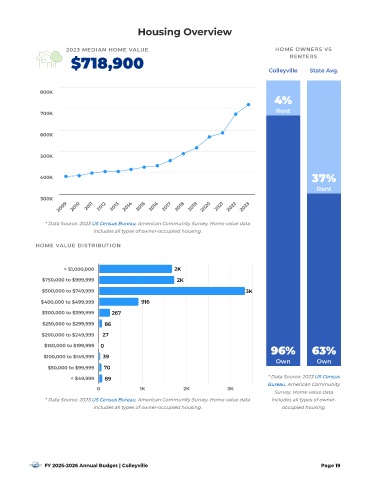
Ho using Over view

                                                                                            H  O  M  E     O  W  N E  R  S     V S
                       2 0  2 3     M  E  D  I  A  N     H O  M  E    V A  L U  E
                                                                                                 R E  N T  E R S
                         B718,900
                                                                                          Colleyville   State Avg.


              800K
                                                                                            4%
                                                                                            Rent
              700K


              600K


              500K


              400K
                                                                                                        37%
                                                                                                          Rent
              300K
                    2009  2010  2011  2012  2013  2014  2015  2016  2017  2018  2019  2020  2021  2022  2023


                * Data Source: 2023 US Census Bureau, American Community Sur vey. Home value data
                                includes all types of owner- occupied housing.

             H O M  E   V A  L  U  E   D  I  S T R  I  B  U  T  I  O  N


                                                            K
                                                            K
                                                           2
                      > $1,000,000                         2   2K
               $750,000 to $999,999
                                                             K
                                                              2 K
                                                            2K
                                                            2
               $500,000 to $749,999                                                 3 K
                                                                                  3
                                                                                   K
                                                                                  3K
                                                 6

                                                916
                                                9
               $ 400,000 to $ 499,999           9 1 1 6
               $300,000 to $399,999     267
                                        7
                                       6
                                       6
                                      2
                                      2
                                        7
                                     6
               $250,000 to $299,999    8 6
                                    8
                                    86
               $200,000 to $249,999  2 7
                                   2

                                    7
                                   27
                $150,000 to $199,999
                                  0
                                  0
                                  0
                                                                                           96%          63%
                                   3
                                   3

                                    9
               $100,000 to $149,999  39
                                    9
                                                                                            Own           Own
                 $50,000 to $99,999  7 0
                                   70
                                    0

                                   7
                                                                                          * Data Source: 2023 US Census

                        < $ 49,999  89
                                    8
                                    8
                                     9
                                     9
                                                                                          Bureau, American Community
                                 0             1K             2K            3K
                                                                                            Sur vey. Home value data
                * Data Source: 2023 US Census Bureau, American Community Sur vey. Home value data  includes all types of owner-
                                includes all types of owner- occupied housing.                occupied housing.
                FY 2025-2026 Annual Budget | Colleyville                                                   Page 19